

Refer to the table below containing the market demand and supply schedules for leather jackets. a. Draw
Fantastic news! We've Found the answer you've been seeking!
Question:
Refer to the table below containing the market demand and supply schedules for leather jackets.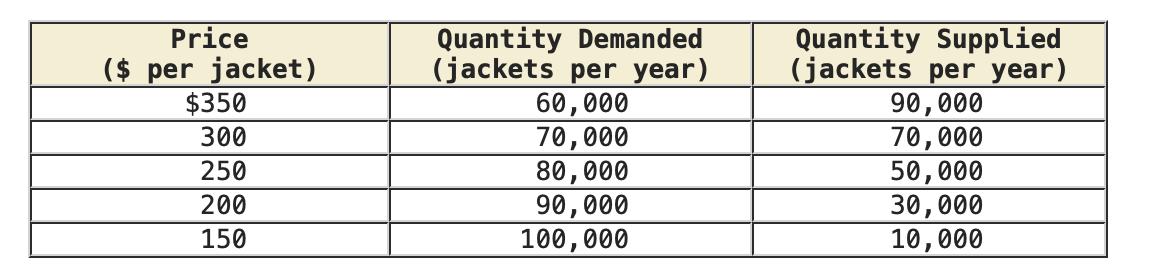
a. Draw a graph showing the market demand and supply curves, D and S0, and the associated equilibrium point. Use the line tools provided to plot only the 2 endpoints of each curve. Indicate each equilibrium point with the tool provided.
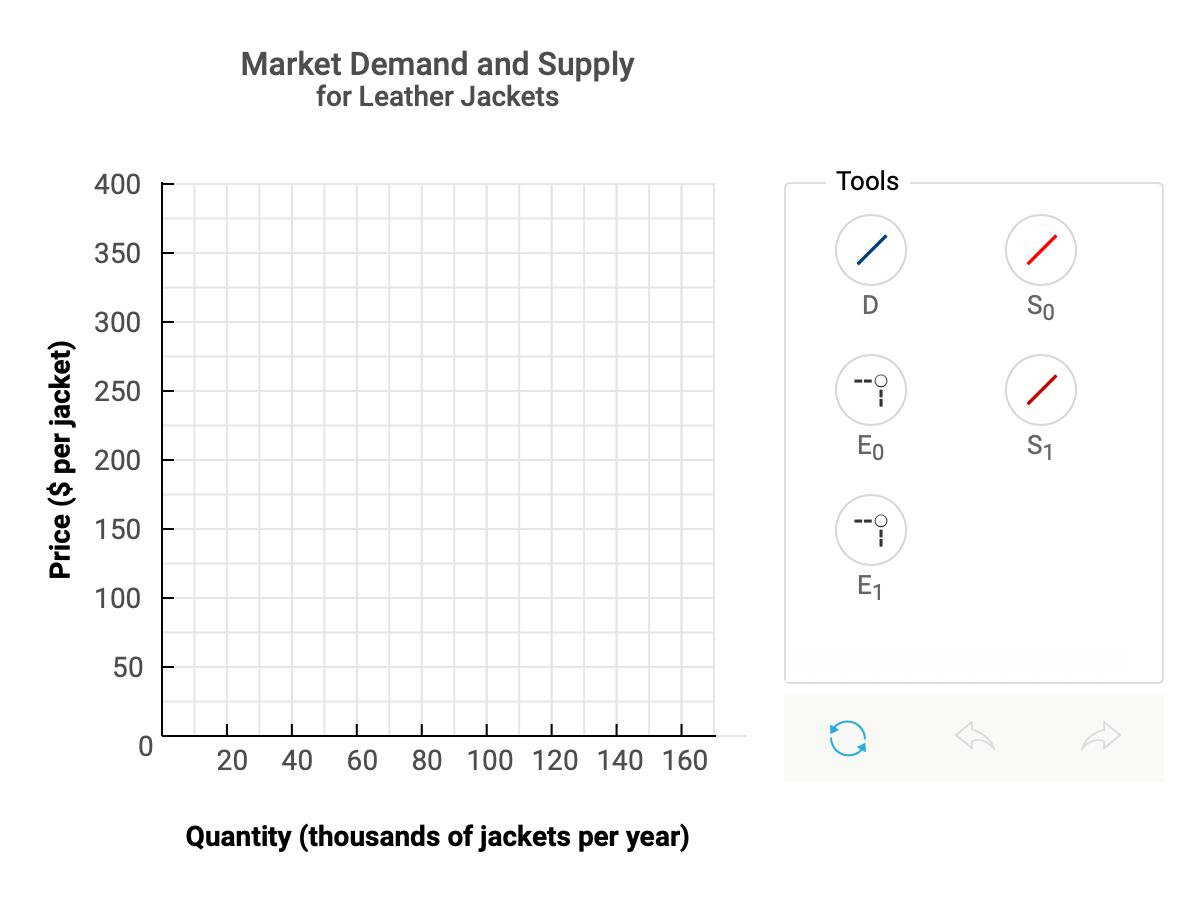
b. The equilibrium price is $ ___ and the equilibrium quantity is ___ jackets.
c. Due to an increase in the number of producers, the annual quantity supplied in this market increases by 60,000 jackets at every price.
The new equilibrium price is $ ____ and the new equilibrium quantity is ____ jackets.
Expert Answer:

Related Book For 

Macroeconomics
ISBN: 978-1319120054
3rd Canadian edition
Authors: Paul Krugman, Robin Wells , Iris Au , Jack Parkinson
Posted Date:
