

GENERAL INSTRUCTIONS: You will execute multiple regression models using data in the worksheets, Time Series Data...
Fantastic news! We've Found the answer you've been seeking!
Question:
Transcribed Image Text:
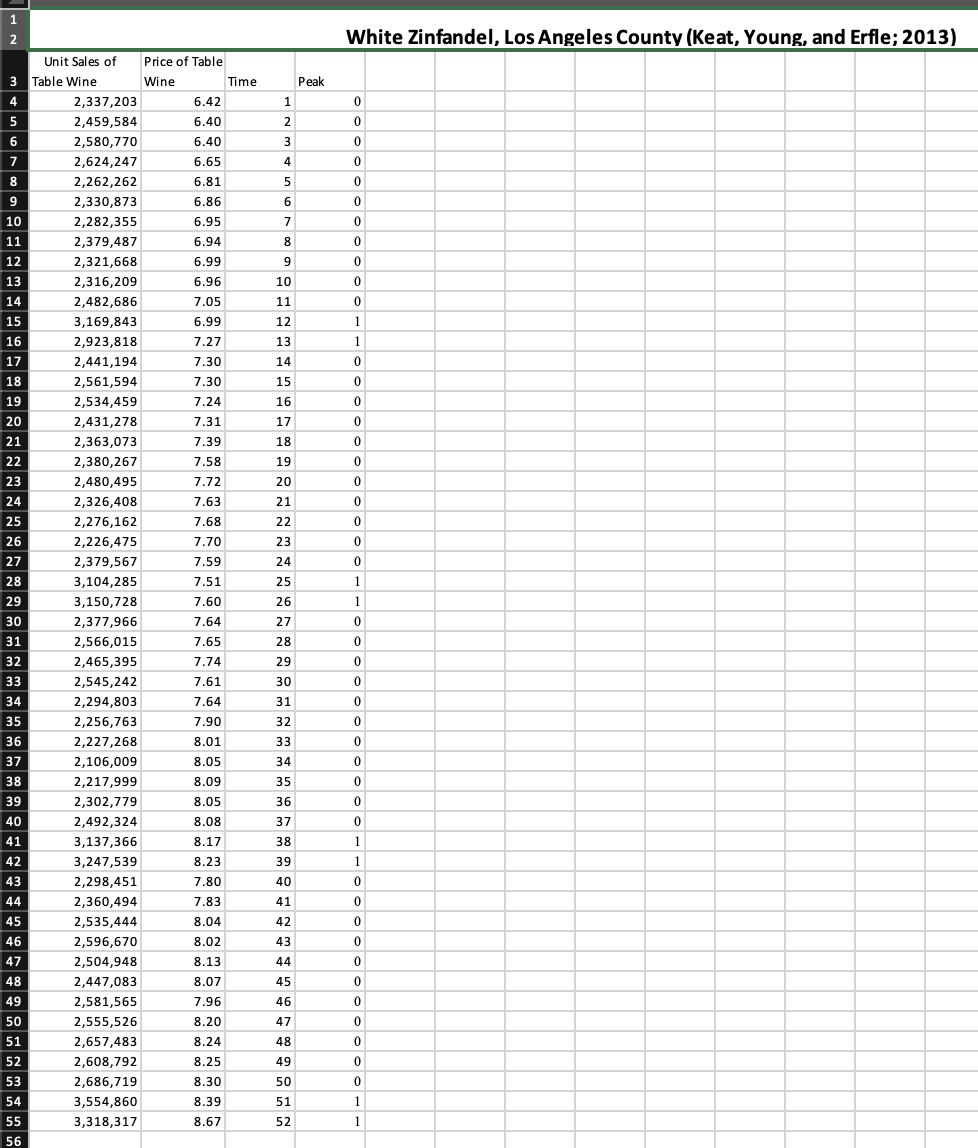
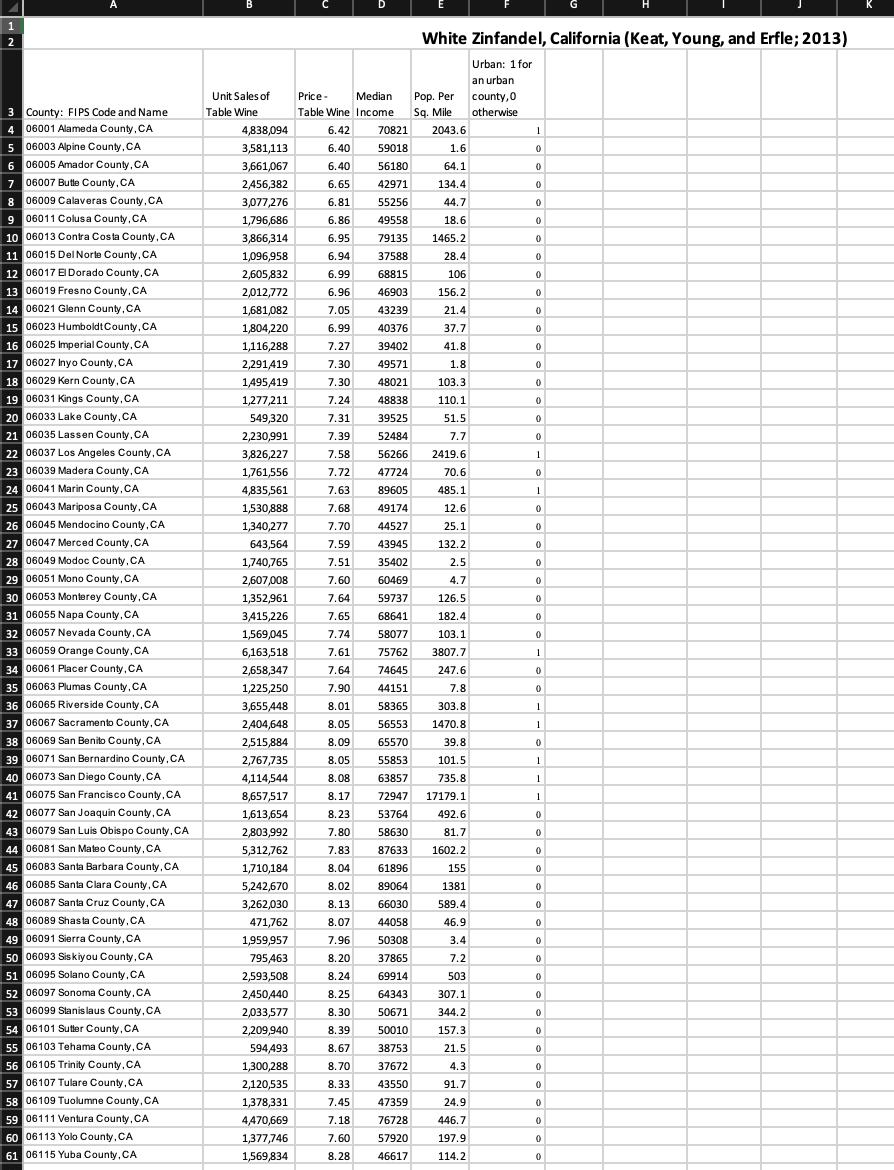
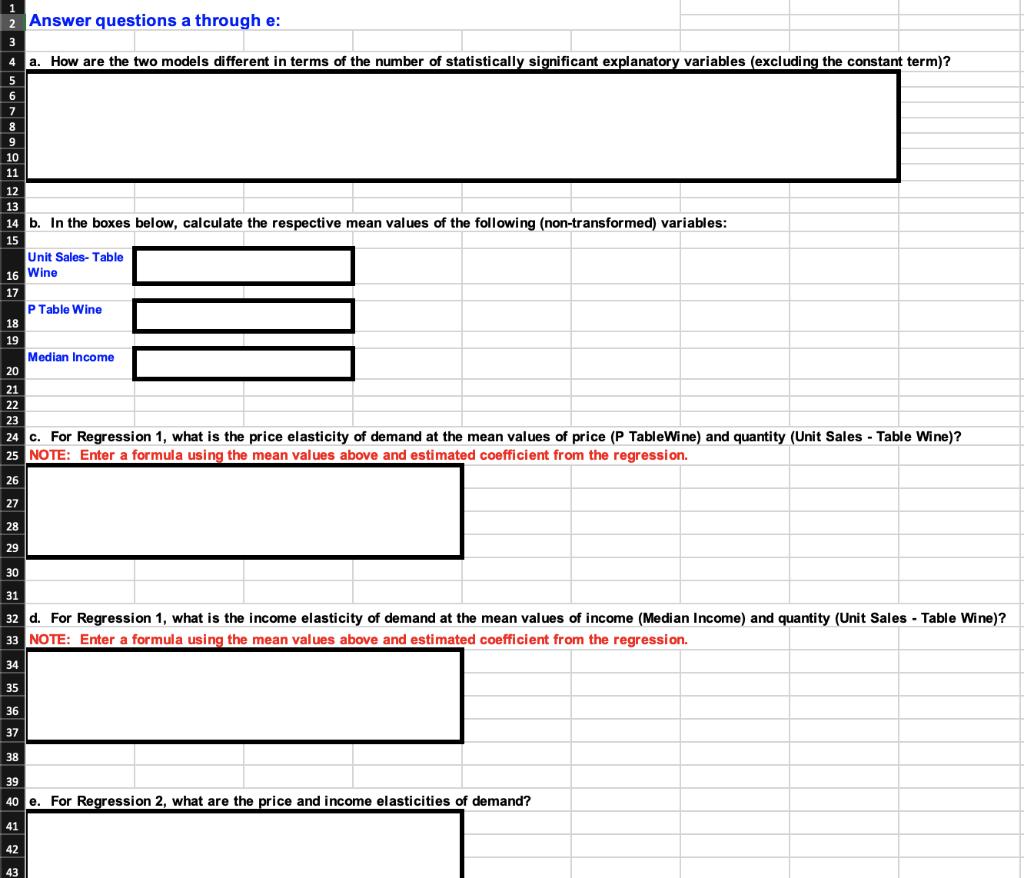
GENERAL INSTRUCTIONS: You will execute multiple regression models using data in the worksheets, "Time Series Data" and "Cross Sectional Data." For all regressions, you will use the same dependent variable (Unit Sales (i.e. bottles) of Table Wine), and use all of the independent variables given in each worksheet (although ignore column A in the Cross Sectional worksheet). SPECIFIC INSTRUCTIONS: Part 1: Run a time series regression using the data in the "Time Series Data" worksheet, and then answer the questions in the worksheet, QUESTIONS_a. Each observation of the time series data provides unit sales of wine in Los Angeles County as the dependent variable, and a set of independent variables that includes: the price of a bottle of wine (measured in dollars and cents), a trend variable (with a starting value of 1 going up to 52), and a dummy variable, "Peak," indicating the holiday season at the end of the year (NOTE: Each observation represents a four-week period. Thus, every 13 observations represents a year of time). Part 2: Run TWO regressions using the data in the worksheet, "Cross Sectional Data." Each observation of the cross-sectional data provides unit sales of wine in a California county at a particular point in time as the dependent variable, and a set of independent variables that includes: price of a bottle of wine, county median income, county population density, and a dummy variable indicating whether or not the county represents a primarily urban setting. a. Regression 1: Use the data as given. b. Regression 2: Run a log-linear regression model, transforming each continuous (i.e. non-dummy) variable--including the dependent variable-- to its natural log form before running the regression. Use the Excel function, LN(variable), to transform each continuous variable to its natural log form. NOTE: Do not transform the dummy variable, Urban, but include it in your regression. c. After running both regressions, answer the questions in the worksheet, QUESTIONS_b. 1 2 3 Table Wine 4 5 6 7 8 9 10 11 12 13 14 15 16 17 18 19 20 21 22 23 24 25 26 27 28 29 30 31 32 33 34 35 36 37 38 39 40 41 42 43 44 45 46 47 48 49 50 51 52 53 54 Unit Sales of 55 56 2,337,203 2,459,584 2,580,770 2,624,247 2,262,262 2,330,873 2,282,355 2,379,487 2,321,668 2,316,209 2,482,686 3,169,843 2,923,818 2,441,194 2,561,594 2,534,459 2,431,278 2,363,073 2,380,267 2,480,495 2,326,408 2,276,162 2,226,475 2,379,567 3,104,285 3,150,728 2,377,966 2,566,015 2,465,395 2,545,242 2,294,803 2,256,763 2,227,268 2,106,009 2,217,999 2,302,779 2,492,324 3,137,366 3,247,539 2,298,451 2,360,494 2,535,444 2,596,670 2,504,948 2,447,083 2,581,565 2,555,526 2,657,483 2,608,792 2,686,719 3,554,860 3,318,317 Price of Table Wine 6.42 6.40 6.40 6.65 6.81 6.86 6.95 6.94 6.99 6.96 7.05 6.99 7.27 7.30 7.30 7.24 7.31 7.39 7.58 7.72 7.63 7.68 7.70 7.59 7.51 7.60 7.64 7.65 7.74 7.61 7.64 7.90 8.01 8.05 8.09 8.05 8.08 8.17 8.23 7.80 7.83 8.04 8.02 8.13 8.07 7.96 8.20 8.24 8.25 8.30 8.39 8.67 Time 1 2 3 4 5 6 7 8 9 10 11 12 13 14 15 16 17 18 19 20 21 22 23 24 25 26 27 28 29 30 31 32 33 34 35 36 37 38 39 40 41 42 43 44 45 46 47 48 49 50 51 52 Peak White Zinfandel, Los Angeles County (Keat, Young, and Erfle; 2013) 0 0 0 0 0 0 0 0 0 0 0 1 1 0 0 0 0 0 0 0 0 0 0 0 1 1 0 0 0 0 0 0 0 0 0 0 0 1 1 0 0 0 0 0 0 0 0 0 0 0 1 1 1 2 3 County: FIPS Code and Name 4 06001 Alameda County, CA 5 06003 Alpine County, CA 6 7 8 | 9 10 06005 Amador County, CA 06007 Butle County, CA 06009 Calaveras County, CA 06011Colusa County, CA 06013 Contra Costa County, CA 11 06015 Del Norte County, CA 12 06017 El Dorado County, CA 13 06019 Fresno County, CA 14 06021 Glenn County, CA 15 06023 Humboldt County, CA. 16 06025 Imperial County, CA 17 06027 Inyo County, CA 18 06029 Kern County, CA 19 06031 Kings County, CA 20 06033 Lake County, CA 21 06035 Lassen County, CA 22 06037 Los Angeles County, CA 23 06039 Madera County, CA 24 06041 Marin County, CA 25 06043 Mariposa County, CA 26 06045 Mendocino County, CA 27 06047 Merced County, CA 28 06049 Modoc County, CA. 29 06051 Mono County, CA. 30 06053 Monterey County, CA 31 06055 Napa County, CA 32 06057 Nevada County, CA 33 06059 Orange County, CA 34 06061 Placer County, CA 35 06063 Plumas County, CA. 36 06065 Riverside County, CA 37 06067 Sacramento County, CA 38 06069 San Benito County, CA 39 06071 San Bernardino County, CA 40 06073 San Diego County, CA 41 06075 San Francisco County, CA 42 06077 San Joaquin County, CA 43 06079 San Luis Obispo County, CA 44 06081 San Mateo County, CA 45 06083 Santa Barbara County, CA 46 06085 Santa Clara County, CA 47 06087 Santa Cruz County, CA 48 06089 Shasta County, CA 49 06091 Sierra County, CA 50 06093 Siskiyou County, CA 51 06095 Solano County, CA 52 06097 Sonoma County, CA 53 06099 Stanislaus County, CA 54 06101 Sutter County, CA 55 06103 Tehama County, CA 56 06105 Trinity County, CA 57 06107 Tulare County, CA 58 06109 Tuolumne County, CA 59 06111 Ventura County, CA 60 06113 Yolo County, CA 61 06115 Yuba County, CA B Unit Sales of Table Wine 4,838,094 3,581,113 3,661,067 2,456,382 3,077,276 1,796,686 3,866,314 1,096,958 2,605,832 2,012,772 1,681,082 1,804,220 1,116,288 2,291,419 1,495,419 1,277,211 549,320 2,230,991 3,826,227 1,761,556 4,835,561 1,530,888 1,340,277 643,564 1,740,765 2,607,008 1,352,961 3,415,226 1,569,045 6,163,518 2,658,347 1,225,250 3,655,448 2,404,648 2,515,884 2,767,735 4,114,544 8,657,517 1,613,654 2,803,992 5,312,762 1,710,184 5,242,670 3,262,030 471,762 1,959,957 795,463 2,593,508 2,450,440 2,033,577 2,209,940 594,493 1,300,288 2,120,535 1,378,331 4,470,669 1,377,746 1,569,834 Price- Median Table Wine Income 6.42 6.40 6.40 6.65 6.81 6.86 6.95 6.94 6.99 6.96 7.05 6.99 8.67 8.70 8.33 7.45 7.18 7.60 8.28 White Zinfandel, California (Keat, Young, and Erfle; 2013) Urban: 1 for an urban county, 0 otherwise 43550 47359 76728 57920 46617 Pop. Per Sq. Mile 70821 59018 56180 42971 55256 49558 79135 37588 68815 46903 156.2 43239 21.4 40376 37.7 7.27 39402 41.8 7.30 49571 1.8 7.30 48021 103.3 7.24 48838 110.1 7.31 39525 51.5 7.39 52484 7.7 7.58 56266 2419.6 7.72 47724 70.6 7.63 89605 485.1 7.68 49174 12.6 7.70 44527 25.1 7.59 43945 132.2 7.51 35402 2.5 7.60 60469 4.7 7.64 59737 126.5 182.4 68641 58077 103.1 7.65 7.74 7.61 7.64 75762 3807.7 74645 247.6 7.90 44151 7.8 8.01 58365 303.8 8.05 56553 1470.8 8.09 65570 39.8 8.05 55853 101.5 63857 735.8 72947 17179.1 492.6 81.7 1602.2 89064 8.08 8.17 8.23 53764 7.80 58630 7.83 87633 8.04 61896 8.02 8.13 8.07 7.96 8.20 37865 8.24 8.25 8.30 66030 44058 50308 69914 64343 50671 8.39 50010 38753 37672 2043.6 1.6 64.1 134.4 44.7 18.6 1465.2 28.4 106 155 1381 589.4 46.9 3.4 7.2 503 307.1 344.2 157.3 21.5 4.3 91.7 24.9 446.7 197.9 114.2 1 0 0 0 0 0 0 0 0 0 0 0 0 0 0 0 0 0 1 0 1 0 0 0 0 0 0 0 0 1 0 0 1 1 0 1 1 1 0 0 0 0 0 0 0 0 0 0 0 0 0 0 0 0 0 0 0 0 2 Answer questions a through e: 4 a. How are the two models different in terms of the number of statistically significant explanatory variables (excluding the constant term)? 5 6 10 12 14 b. In the boxes below, calculate the respective mean values of the following (non-transformed) variables: 15 Unit Sales- Table 16 Wine 17 18 19 P Table Wine Median Income 20 21 22 23 24 c. For Regression 1, what is the price elasticity of demand at the mean values of price (P TableWine) and quantity (Unit Sales - Table Wine)? 25 NOTE: Enter a formula using the mean values above and estimated coefficient from the regression. 26 27 28 29 30 31 32 d. For Regression 1, what is the income elasticity of demand at the mean values of income (Median Income) and quantity (Unit Sales - Table Wine)? 33 NOTE: Enter a formula using the mean values above and estimated coefficient from the regression. 34 35 36 37 38 39 40 e. For Regression 2, what are the price and income elasticities of demand? 41 42 43 GENERAL INSTRUCTIONS: You will execute multiple regression models using data in the worksheets, "Time Series Data" and "Cross Sectional Data." For all regressions, you will use the same dependent variable (Unit Sales (i.e. bottles) of Table Wine), and use all of the independent variables given in each worksheet (although ignore column A in the Cross Sectional worksheet). SPECIFIC INSTRUCTIONS: Part 1: Run a time series regression using the data in the "Time Series Data" worksheet, and then answer the questions in the worksheet, QUESTIONS_a. Each observation of the time series data provides unit sales of wine in Los Angeles County as the dependent variable, and a set of independent variables that includes: the price of a bottle of wine (measured in dollars and cents), a trend variable (with a starting value of 1 going up to 52), and a dummy variable, "Peak," indicating the holiday season at the end of the year (NOTE: Each observation represents a four-week period. Thus, every 13 observations represents a year of time). Part 2: Run TWO regressions using the data in the worksheet, "Cross Sectional Data." Each observation of the cross-sectional data provides unit sales of wine in a California county at a particular point in time as the dependent variable, and a set of independent variables that includes: price of a bottle of wine, county median income, county population density, and a dummy variable indicating whether or not the county represents a primarily urban setting. a. Regression 1: Use the data as given. b. Regression 2: Run a log-linear regression model, transforming each continuous (i.e. non-dummy) variable--including the dependent variable-- to its natural log form before running the regression. Use the Excel function, LN(variable), to transform each continuous variable to its natural log form. NOTE: Do not transform the dummy variable, Urban, but include it in your regression. c. After running both regressions, answer the questions in the worksheet, QUESTIONS_b. 1 2 3 Table Wine 4 5 6 7 8 9 10 11 12 13 14 15 16 17 18 19 20 21 22 23 24 25 26 27 28 29 30 31 32 33 34 35 36 37 38 39 40 41 42 43 44 45 46 47 48 49 50 51 52 53 54 Unit Sales of 55 56 2,337,203 2,459,584 2,580,770 2,624,247 2,262,262 2,330,873 2,282,355 2,379,487 2,321,668 2,316,209 2,482,686 3,169,843 2,923,818 2,441,194 2,561,594 2,534,459 2,431,278 2,363,073 2,380,267 2,480,495 2,326,408 2,276,162 2,226,475 2,379,567 3,104,285 3,150,728 2,377,966 2,566,015 2,465,395 2,545,242 2,294,803 2,256,763 2,227,268 2,106,009 2,217,999 2,302,779 2,492,324 3,137,366 3,247,539 2,298,451 2,360,494 2,535,444 2,596,670 2,504,948 2,447,083 2,581,565 2,555,526 2,657,483 2,608,792 2,686,719 3,554,860 3,318,317 Price of Table Wine 6.42 6.40 6.40 6.65 6.81 6.86 6.95 6.94 6.99 6.96 7.05 6.99 7.27 7.30 7.30 7.24 7.31 7.39 7.58 7.72 7.63 7.68 7.70 7.59 7.51 7.60 7.64 7.65 7.74 7.61 7.64 7.90 8.01 8.05 8.09 8.05 8.08 8.17 8.23 7.80 7.83 8.04 8.02 8.13 8.07 7.96 8.20 8.24 8.25 8.30 8.39 8.67 Time 1 2 3 4 5 6 7 8 9 10 11 12 13 14 15 16 17 18 19 20 21 22 23 24 25 26 27 28 29 30 31 32 33 34 35 36 37 38 39 40 41 42 43 44 45 46 47 48 49 50 51 52 Peak White Zinfandel, Los Angeles County (Keat, Young, and Erfle; 2013) 0 0 0 0 0 0 0 0 0 0 0 1 1 0 0 0 0 0 0 0 0 0 0 0 1 1 0 0 0 0 0 0 0 0 0 0 0 1 1 0 0 0 0 0 0 0 0 0 0 0 1 1 1 2 3 County: FIPS Code and Name 4 06001 Alameda County, CA 5 06003 Alpine County, CA 6 7 8 | 9 10 06005 Amador County, CA 06007 Butle County, CA 06009 Calaveras County, CA 06011Colusa County, CA 06013 Contra Costa County, CA 11 06015 Del Norte County, CA 12 06017 El Dorado County, CA 13 06019 Fresno County, CA 14 06021 Glenn County, CA 15 06023 Humboldt County, CA. 16 06025 Imperial County, CA 17 06027 Inyo County, CA 18 06029 Kern County, CA 19 06031 Kings County, CA 20 06033 Lake County, CA 21 06035 Lassen County, CA 22 06037 Los Angeles County, CA 23 06039 Madera County, CA 24 06041 Marin County, CA 25 06043 Mariposa County, CA 26 06045 Mendocino County, CA 27 06047 Merced County, CA 28 06049 Modoc County, CA. 29 06051 Mono County, CA. 30 06053 Monterey County, CA 31 06055 Napa County, CA 32 06057 Nevada County, CA 33 06059 Orange County, CA 34 06061 Placer County, CA 35 06063 Plumas County, CA. 36 06065 Riverside County, CA 37 06067 Sacramento County, CA 38 06069 San Benito County, CA 39 06071 San Bernardino County, CA 40 06073 San Diego County, CA 41 06075 San Francisco County, CA 42 06077 San Joaquin County, CA 43 06079 San Luis Obispo County, CA 44 06081 San Mateo County, CA 45 06083 Santa Barbara County, CA 46 06085 Santa Clara County, CA 47 06087 Santa Cruz County, CA 48 06089 Shasta County, CA 49 06091 Sierra County, CA 50 06093 Siskiyou County, CA 51 06095 Solano County, CA 52 06097 Sonoma County, CA 53 06099 Stanislaus County, CA 54 06101 Sutter County, CA 55 06103 Tehama County, CA 56 06105 Trinity County, CA 57 06107 Tulare County, CA 58 06109 Tuolumne County, CA 59 06111 Ventura County, CA 60 06113 Yolo County, CA 61 06115 Yuba County, CA B Unit Sales of Table Wine 4,838,094 3,581,113 3,661,067 2,456,382 3,077,276 1,796,686 3,866,314 1,096,958 2,605,832 2,012,772 1,681,082 1,804,220 1,116,288 2,291,419 1,495,419 1,277,211 549,320 2,230,991 3,826,227 1,761,556 4,835,561 1,530,888 1,340,277 643,564 1,740,765 2,607,008 1,352,961 3,415,226 1,569,045 6,163,518 2,658,347 1,225,250 3,655,448 2,404,648 2,515,884 2,767,735 4,114,544 8,657,517 1,613,654 2,803,992 5,312,762 1,710,184 5,242,670 3,262,030 471,762 1,959,957 795,463 2,593,508 2,450,440 2,033,577 2,209,940 594,493 1,300,288 2,120,535 1,378,331 4,470,669 1,377,746 1,569,834 Price- Median Table Wine Income 6.42 6.40 6.40 6.65 6.81 6.86 6.95 6.94 6.99 6.96 7.05 6.99 8.67 8.70 8.33 7.45 7.18 7.60 8.28 White Zinfandel, California (Keat, Young, and Erfle; 2013) Urban: 1 for an urban county, 0 otherwise 43550 47359 76728 57920 46617 Pop. Per Sq. Mile 70821 59018 56180 42971 55256 49558 79135 37588 68815 46903 156.2 43239 21.4 40376 37.7 7.27 39402 41.8 7.30 49571 1.8 7.30 48021 103.3 7.24 48838 110.1 7.31 39525 51.5 7.39 52484 7.7 7.58 56266 2419.6 7.72 47724 70.6 7.63 89605 485.1 7.68 49174 12.6 7.70 44527 25.1 7.59 43945 132.2 7.51 35402 2.5 7.60 60469 4.7 7.64 59737 126.5 182.4 68641 58077 103.1 7.65 7.74 7.61 7.64 75762 3807.7 74645 247.6 7.90 44151 7.8 8.01 58365 303.8 8.05 56553 1470.8 8.09 65570 39.8 8.05 55853 101.5 63857 735.8 72947 17179.1 492.6 81.7 1602.2 89064 8.08 8.17 8.23 53764 7.80 58630 7.83 87633 8.04 61896 8.02 8.13 8.07 7.96 8.20 37865 8.24 8.25 8.30 66030 44058 50308 69914 64343 50671 8.39 50010 38753 37672 2043.6 1.6 64.1 134.4 44.7 18.6 1465.2 28.4 106 155 1381 589.4 46.9 3.4 7.2 503 307.1 344.2 157.3 21.5 4.3 91.7 24.9 446.7 197.9 114.2 1 0 0 0 0 0 0 0 0 0 0 0 0 0 0 0 0 0 1 0 1 0 0 0 0 0 0 0 0 1 0 0 1 1 0 1 1 1 0 0 0 0 0 0 0 0 0 0 0 0 0 0 0 0 0 0 0 0 2 Answer questions a through e: 4 a. How are the two models different in terms of the number of statistically significant explanatory variables (excluding the constant term)? 5 6 10 12 14 b. In the boxes below, calculate the respective mean values of the following (non-transformed) variables: 15 Unit Sales- Table 16 Wine 17 18 19 P Table Wine Median Income 20 21 22 23 24 c. For Regression 1, what is the price elasticity of demand at the mean values of price (P TableWine) and quantity (Unit Sales - Table Wine)? 25 NOTE: Enter a formula using the mean values above and estimated coefficient from the regression. 26 27 28 29 30 31 32 d. For Regression 1, what is the income elasticity of demand at the mean values of income (Median Income) and quantity (Unit Sales - Table Wine)? 33 NOTE: Enter a formula using the mean values above and estimated coefficient from the regression. 34 35 36 37 38 39 40 e. For Regression 2, what are the price and income elasticities of demand? 41 42 43
Expert Answer:
Answer rating: 100% (QA)
Answer to Question a According to the different aspects displayed from the two models it is clear th... View the full answer

Related Book For 

Statistical Techniques in Business and Economics
ISBN: 978-1259666360
17th edition
Authors: Douglas A. Lind, William G Marchal
Posted Date:
Students also viewed these accounting questions
-
In the past, schools in Los Angeles County have closed an average of 3 days each year for weather emergencies. What is the probability that schools in Los Angeles County will close for 4 days next...
-
Although the time series data in Table P-18 are old, they provide the basis for some interesting regression modeling. Using the data in Table P-18, attempt to relate personal savings to personal...
-
Refer to the time series data in Exercise 1. Using the average of all the historical data as a forecast for the next period, compute the following measures of forecast accuracy: a. Mean absolute...
-
A firm has total debt of $6,000,000 and stockholder's equity is $4,000,000. The firm wants to calculate equity-to- total asset ratio in order to make decision about further raise of capital. What is...
-
Could the solution to the firm's cost-minimization problem ever occur off the isoquant representing the required level of output?
-
A common textbook problem asks you to calculate the resistance of a cone-shaped object, of resistivity p, with length L, radius a at one end, and radius b at the other (Fig. 7.50). The two ends are...
-
Allan and Koraev both owned condominiums in the same building. Koraevs unit was directly above Allans. While Allan lived in her own unit, Koraev leased his. The leasing of Koraevs unit was managed by...
-
It is proposed to air-cool the cylinders of a combustion chamber by joining an aluminum casing with annular fins (k = 240 W/m K) to the cylinder wall (k = 50 W/m K). The air is at 320K and the...
-
he accounts from the Adjusted Trial Balance are listed in alphabetical order. What is the total longminusterm liabilities? Baker Service Company Adjusted Trial Balance September 30, 2025 Balance...
-
A Gallup Poll utilizing a random sample of 1,503 adults ages 18 or older was conducted in April 2018. The survey indicated a majority of Americans (53%) say driverless cars will be common in the next...
-
4) Hackers utilize the hacking process to achieve certain "end-effects" on their target. Provide examples or case studies of attacks your threat actor has been involved with over the years and...
-
Hillary and Tom have one child, Kitty. In 2015 Hillary and Tom entered into a written agreement providing that Tom would pay Hillary $5,000 each year in alimony and $10,000 each year in child...
-
The valve company purchased preferred stocks in another company the preferred stocks before tax yield was 13.2% the corporate tax rate is 40% what is the after tax return on the preferred stock...
-
Telecom Italia is considering the investment in a capital project. The initial cost in year 0 is $130,000 to be depreciated straight over 5 years to an expected salvage value of $15,000. The firms...
-
Doug and Annette are getting divorced. Doug agreed to transfer Blueacre to Annette as long as Annette agreed to treat the transfer as a sale by Doug. Doug's basis in Blueacre was $10,000 and its fair...
-
Since 9/11, what was the worst year for terrorism deaths in the world on record?
-
In March of 2020, much of the Country went into a lockdown, because of Covid -19. Most businesses were closed for two weeks and only businesses deemed "essential," were permitted to remain open. Each...
-
A Alkynes can be made by dehydrohalogenation of vinylic halides in a reaction that is essentially an E2 process. In studying the stereochemistry of this elimination, it was found that...
-
Youre about to drive to New York. If your cars engine is out of tune, your gas cost will increase by $100. Having the engine tested will cost $20. If its out of tune, repairs will cost $60. Before...
-
The first Super Bowl was played in 1967. The cost for a 30-second commercial was $42,000. The cost of a 30-second commercial for Super Bowl 50 was $4.6 million. What was the geometric mean rate of...
-
Compute Laspeyres price index for 2016 using 1990 as the base period. Price 1990 $0.287 Quantity 2016 Item Aluminum (cents per pound) Natural gas (1,000 cu. ft.) Petroleum (barrel) Platinum (troy...
-
Lacy is a single taxpayer. In 2019, her taxable income is $40,000. What is her tax liability in each of the following alternative situations? a. All of her income is salary from her employer. b. Her...
-
For 2019, Sherri has a short-term loss of $2,500 and a long-term loss of $4,750. a. How much loss can Sherri deduct in 2019? b. How much loss will Sherri carry over to 2020, and what is the character...
-
Whitney received $75,000 of taxable income in 2019. All of the income was salary from her employer. What is her income tax liability in each of the following alternative situations? a. She files...

Study smarter with the SolutionInn App