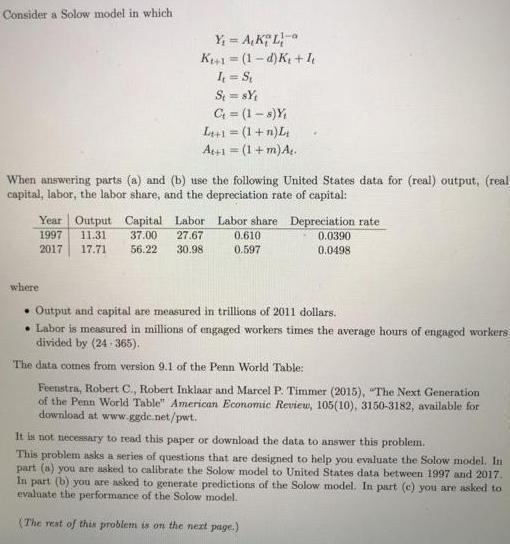
Consider a Solow model in which Y = A,K, L- K+1=(1-d) K + I I =...
Fantastic news! We've Found the answer you've been seeking!
Question:
Transcribed Image Text:
Consider a Solow model in which Y₁ = A,K, L- K+1=(1-d) K + I I₁ = St St=8Y₁ G₁ = (1-8) Y₁ L₁+1 = (1 + n) L₂ At+1 = (1 + m) A. When answering parts (a) and (b) use the following United States data for (real) output, (real) capital, labor, the labor share, and the depreciation rate of capital: where Year Output Capital Labor Labor share Depreciation rate 11.31 37.00 27.67 1997 2017 17.71 56.22 30.98 0.610 0.597 0.0390 0.0498 • Output and capital are measured in trillions of 2011 dollars. Labor is measured in millions of engaged workers times the average hours of engaged workers divided by (24-365). The data comes from version 9.1 of the Penn World Table: Feenstra, Robert C., Robert Inklaar and Marcel P. Timmer (2015), "The Next Generation of the Penn World Table" American Economic Review, 105(10), 3150-3182, available for download at www.ggdc.net/pwt. It is not necessary to read this paper or download the data to answer this problem. This problem asks a series of questions that are designed to help you evaluate the Solow model. In part (a) you are asked to calibrate the Solow model to United States data between 1997 and 2017. In part (b) you are asked to generate predictions of the Solow model. In part (e) you are asked to evaluate the performance of the Solow model. (The rest of this problem is on the next page.) (a) Calibrating the Solow model. Compute the following quantities: i. The constant value of the capital share, a, that can match the average value of the labor share in 1997 and 2017. (Recall a is the capital share, not the labor share.) i. The constant value of the capital depreciation rate, d, that can match the average value of the depreciation rate in 1997 and 2017. iii. Productivity in 1997 and in 2017. iv. The constant yearly growth rate of labor, n, such that, when labor is generated by the Solow model, L1997 and L2017 exactly match labor data in 1997 and 2017. v. The constant yearly growth rate of productivity, m, such that, when productivity is gen- erated by the Solow model, A1907 and A2017 exactly match productivity in 1997 and 2017. Use the computed values in the rest of this problem. (b) Generating predictions of the Solow model. Assume the Solow model applies to the United States between 1997 and 2017. Let the initial values of capital and labor be the actual values of capital and labor in 1997. Let the initial value of productivity be the value that you computed in part (a), subpart iii., for 1997. Let the saving rate be 0.210. For all the years between 1997 and 2017, simulate the Solow model to find predicted values for capital, output, investment, productivity, and labor in the United States. (e) Evaluating the Solow model. Compare (some of) the predictions of the Solow model to actual United States data. Is the Solow model consistent with United States data? Can you improve the fit of the Solow model by changing the saving rate? You may, but are not required to, use additional data (data that is not provided on this problem) to answer this part. Consider a Solow model in which Y₁ = A,K, L- K+1=(1-d) K + I I₁ = St St=8Y₁ G₁ = (1-8) Y₁ L₁+1 = (1 + n) L₂ At+1 = (1 + m) A. When answering parts (a) and (b) use the following United States data for (real) output, (real) capital, labor, the labor share, and the depreciation rate of capital: where Year Output Capital Labor Labor share Depreciation rate 11.31 37.00 27.67 1997 2017 17.71 56.22 30.98 0.610 0.597 0.0390 0.0498 • Output and capital are measured in trillions of 2011 dollars. Labor is measured in millions of engaged workers times the average hours of engaged workers divided by (24-365). The data comes from version 9.1 of the Penn World Table: Feenstra, Robert C., Robert Inklaar and Marcel P. Timmer (2015), "The Next Generation of the Penn World Table" American Economic Review, 105(10), 3150-3182, available for download at www.ggdc.net/pwt. It is not necessary to read this paper or download the data to answer this problem. This problem asks a series of questions that are designed to help you evaluate the Solow model. In part (a) you are asked to calibrate the Solow model to United States data between 1997 and 2017. In part (b) you are asked to generate predictions of the Solow model. In part (e) you are asked to evaluate the performance of the Solow model. (The rest of this problem is on the next page.) (a) Calibrating the Solow model. Compute the following quantities: i. The constant value of the capital share, a, that can match the average value of the labor share in 1997 and 2017. (Recall a is the capital share, not the labor share.) i. The constant value of the capital depreciation rate, d, that can match the average value of the depreciation rate in 1997 and 2017. iii. Productivity in 1997 and in 2017. iv. The constant yearly growth rate of labor, n, such that, when labor is generated by the Solow model, L1997 and L2017 exactly match labor data in 1997 and 2017. v. The constant yearly growth rate of productivity, m, such that, when productivity is gen- erated by the Solow model, A1907 and A2017 exactly match productivity in 1997 and 2017. Use the computed values in the rest of this problem. (b) Generating predictions of the Solow model. Assume the Solow model applies to the United States between 1997 and 2017. Let the initial values of capital and labor be the actual values of capital and labor in 1997. Let the initial value of productivity be the value that you computed in part (a), subpart iii., for 1997. Let the saving rate be 0.210. For all the years between 1997 and 2017, simulate the Solow model to find predicted values for capital, output, investment, productivity, and labor in the United States. (e) Evaluating the Solow model. Compare (some of) the predictions of the Solow model to actual United States data. Is the Solow model consistent with United States data? Can you improve the fit of the Solow model by changing the saving rate? You may, but are not required to, use additional data (data that is not provided on this problem) to answer this part.
Expert Answer:
Answer rating: 100% (QA)
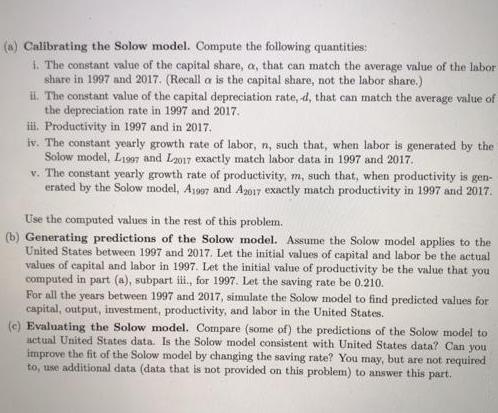
i The constant value of the capital share a that can match the average value of the labor share in 1997 and 2017 Recall a is the capital share not the labor share The average labor share in 1997 and 2... View the full answer
Related Book For
Posted Date:
Students also viewed these finance questions
-
Consider a Solow economy that begins with a capital stock equal to $300 billion, and suppose its steady-state level of capital is $500 billion. To its pleasant surprise, the economy receives a...
-
Question 1: a. Consider the following two estimated model: Model 1: Model 2 : Is it true that o = and do b. Show that and a = ? Why or why not? where y = Bo + Bx x = do +n (x-x) = 0 i=1 where is the...
-
(a) Find u(01, M) for o = ( m). (b) Find u2(01, R) for o- (3,0, ). (c) Find u(01, 02) for o1 = (, 1) and o- (d) Find uz(o1, 02) for a1 = (G, ,) and aa- M R U 8,1 0, 2 4,0 3. 3 1, 2 0,0 D 5,0 2, 3 8, 1
-
In Exercises find the positive values of p for which the series converges. n=1 n
-
What is the Disney service model?
-
Review the description of the ethical issues surrounding political behavior in organizations. Do you accept or reject the normative positions taken from the various ethics theories? Why or why not?
-
What items must be included in a trial notebook?
-
The Blazon Manufacturing Companys costing system has two direct- cost categories: direct materials and direct manufacturing labor. Manufacturing overhead (both variable and fixed) is allocated to...
-
If the quoted dividend yield in the paper was 2.2% and the dividend was listed as $0.72 what price is used in the calculation of dividend yield?
-
A cross-flow molecular filtration device equipped with a mesoporous membrane is used to separate the enzyme lysozyme from a fermentation broth, as shown in the figure (right column). Water at...
-
What alternatives to imprisonment exist to deal with violent criminals who are repeat offenders? What alternatives, if any, would you propose? What legal problems are implicit in these alternatives...
-
Write notes on computer integrated manufacturing system and CAD/CAM.
-
What is NC machine? Explain its applications and limitations.
-
Differentiate between normalizing and annealing.
-
An analyst engaged in the tourism industry obtained detailed information on 76 travel packages offered by a Viennese travel agency. The file Travel contains the following variables: - Price (price of...
-
Differentiate between hardening and tempering.
-
Kroger Co. is one of the largest retail food companies in the United States as measured by total annual sales. The Kroger Co. operates supermarkets, convenience stores, and manufactures and processes...
-
Create an appropriate display of the navel data collected in Exercise 25 of Section 3.1. Discuss any special properties of this distribution. Exercise 25 The navel ratio is defined to be a persons...
-
What is the Euler equation for consumption, and what is its economic interpretation?
-
What are the costs of inflation, and how can these costs be avoided?
-
The debt-GDP ratio in Belgium exceeded 120% in the early 1990s and has fallen to just over 80% more recently. Italy had a debt-GDP ratio of about 100% even before the euro crisis. The rapid rise in...
-
What is a post-mortem?
-
A __________ is another name for a project close-out meeting A. celebration B. post project C. final review D. post mortem
-
What advice about project closing is most useful to you? What other advice would you add?
Change The Struggle Empowering Women In The Workplace 1st Edition - ISBN: 979-8889268093 - Free Book
Study smarter with the SolutionInn App