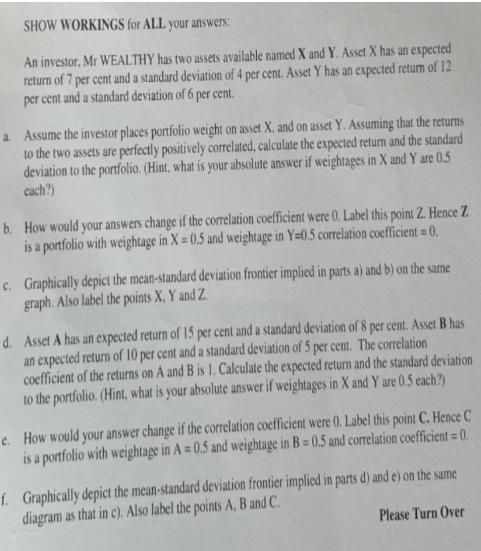
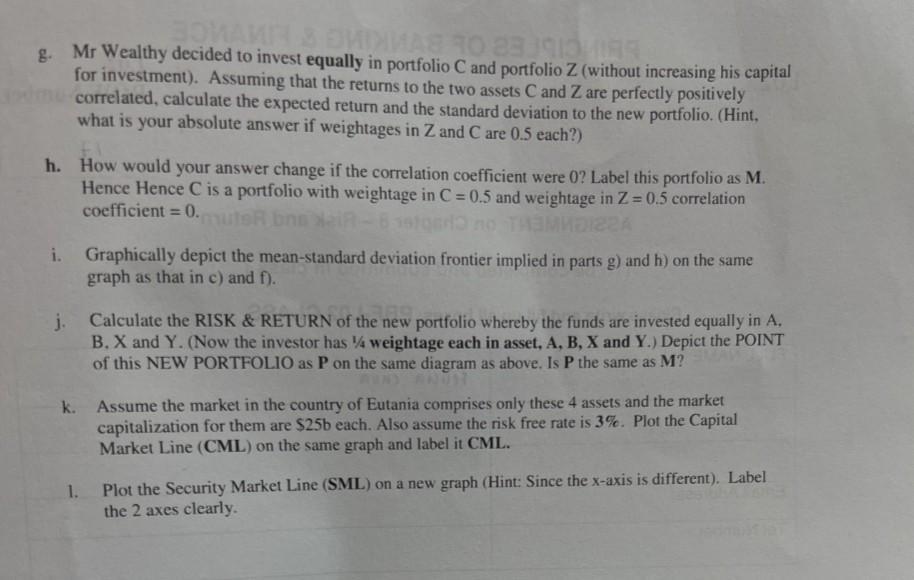
SHOW WORKINGS for ALL your answers: An investor, Mr WEALTHY has two assets available named X...
Fantastic news! We've Found the answer you've been seeking!
Question:
Transcribed Image Text:
SHOW WORKINGS for ALL your answers: An investor, Mr WEALTHY has two assets available named X and Y. Asset X has an expected return of 7 per cent and a standard deviation of 4 per cent. Asset Y has an expected return of 12 per cent and a standard deviation of 6 per cent. a. Assume the investor places portfolio weight on asset X, and on asset Y. Assuming that the returns to the two assets are perfectly positively correlated, calculate the expected return and the standard deviation to the portfolio. (Hint, what is your absolute answer if weightages in X and Y are 0.5 each?) b. How would your answers change if the correlation coefficient were 0. Label this point Z. Hence Z is a portfolio with weightage in X = 0.5 and weightage in Y=0.5 correlation coefficient = 0. c. Graphically depict the mean-standard deviation frontier implied in parts a) and b) on the same graph. Also label the points X, Y and Z d. Asset A has an expected return of 15 per cent and a standard deviation of 8 per cent. Asset B has an expected return of 10 per cent and a standard deviation of 5 per cent. The correlation coefficient of the returns on A and B is 1. Calculate the expected return and the standard deviation to the portfolio. (Hint, what is your absolute answer if weightages in X and Y are 0.5 each?) e. How would your answer change if the correlation coefficient were 0. Label this point C. Hence C is a portfolio with weightage in A = 0.5 and weightage in B = 0.5 and correlation coefficient = 0. f. Graphically depict the mean-standard deviation frontier implied in parts d) and e) on the same diagram as that in c). Also label the points A, B and C. Please Turn Over g. Mr Wealthy decided to invest equally in portfolio C and portfolio Z (without increasing his capital for investment). Assuming that the returns to the two assets C and Z are perfectly positively correlated, calculate the expected return and the standard deviation to the new portfolio. (Hint, what is your absolute answer if weightages in Z and C are 0.5 each?) h. How would your answer change if the correlation coefficient were 0? Label this portfolio as M. Hence Hence C is a portfolio with weightage in C = 0.5 and weightage in Z = 0.5 correlation coefficient = 0.muter bns Mein-6190 no TH i. 122A Graphically depict the mean-standard deviation frontier implied in parts g) and h) on the same graph as that in c) and f). j. Calculate the RISK & RETURN of the new portfolio whereby the funds are invested equally in A, B. X and Y. (Now the investor has 4 weightage each in asset, A, B, X and Y.) Depict the POINT of this NEW PORTFOLIO as P on the same diagram as above. Is P the same as M? k. Assume the market in the country of Eutania comprises only these 4 assets and the market capitalization for them are $25b each. Also assume the risk free rate is 3%. Plot the Capital Market Line (CML) on the same graph and label it CML. 1. Plot the Security Market Line (SML) on a new graph (Hint: Since the x-axis is different). Label the 2 axes clearly. SHOW WORKINGS for ALL your answers: An investor, Mr WEALTHY has two assets available named X and Y. Asset X has an expected return of 7 per cent and a standard deviation of 4 per cent. Asset Y has an expected return of 12 per cent and a standard deviation of 6 per cent. a. Assume the investor places portfolio weight on asset X, and on asset Y. Assuming that the returns to the two assets are perfectly positively correlated, calculate the expected return and the standard deviation to the portfolio. (Hint, what is your absolute answer if weightages in X and Y are 0.5 each?) b. How would your answers change if the correlation coefficient were 0. Label this point Z. Hence Z is a portfolio with weightage in X = 0.5 and weightage in Y=0.5 correlation coefficient = 0. c. Graphically depict the mean-standard deviation frontier implied in parts a) and b) on the same graph. Also label the points X, Y and Z d. Asset A has an expected return of 15 per cent and a standard deviation of 8 per cent. Asset B has an expected return of 10 per cent and a standard deviation of 5 per cent. The correlation coefficient of the returns on A and B is 1. Calculate the expected return and the standard deviation to the portfolio. (Hint, what is your absolute answer if weightages in X and Y are 0.5 each?) e. How would your answer change if the correlation coefficient were 0. Label this point C. Hence C is a portfolio with weightage in A = 0.5 and weightage in B = 0.5 and correlation coefficient = 0. f. Graphically depict the mean-standard deviation frontier implied in parts d) and e) on the same diagram as that in c). Also label the points A, B and C. Please Turn Over g. Mr Wealthy decided to invest equally in portfolio C and portfolio Z (without increasing his capital for investment). Assuming that the returns to the two assets C and Z are perfectly positively correlated, calculate the expected return and the standard deviation to the new portfolio. (Hint, what is your absolute answer if weightages in Z and C are 0.5 each?) h. How would your answer change if the correlation coefficient were 0? Label this portfolio as M. Hence Hence C is a portfolio with weightage in C = 0.5 and weightage in Z = 0.5 correlation coefficient = 0.muter bns Mein-6190 no TH i. 122A Graphically depict the mean-standard deviation frontier implied in parts g) and h) on the same graph as that in c) and f). j. Calculate the RISK & RETURN of the new portfolio whereby the funds are invested equally in A, B. X and Y. (Now the investor has 4 weightage each in asset, A, B, X and Y.) Depict the POINT of this NEW PORTFOLIO as P on the same diagram as above. Is P the same as M? k. Assume the market in the country of Eutania comprises only these 4 assets and the market capitalization for them are $25b each. Also assume the risk free rate is 3%. Plot the Capital Market Line (CML) on the same graph and label it CML. 1. Plot the Security Market Line (SML) on a new graph (Hint: Since the x-axis is different). Label the 2 axes clearly.
Expert Answer:
Answer rating: 100% (QA)
To solve this problem we need to use the concepts of portfolio theory and the calculation of expected return and standard deviation for portfolios a To calculate the expected return and standard devia... View the full answer
Related Book For
Posted Date:
Students also viewed these finance questions
-
Show what happens to the demand curve for labor when the price of gloves falls to $6. What happens when the price increases to $20?
-
Show what happens to the price of a put option in the Black-Scholes model when N(-d1) and N(-d2) tend to 1. How is this different from when N(-d1) and N(-d2) tend to 0?. What is the interpretation...
-
Using the graph below, show what happens to consumer surplus when a new technology reduces the cost of production. Po Quantity
-
In Exercises show that the function y = (x) is a solution of the differential equation. y = 4e-x y" - y = 0
-
In Chapter 6, Exercise 41 we examined the relationship between the fuel economy (mpg) and Engine Size for 35 models of cars (Data in Fuel Economy 2014). Further analysis produces the regression model...
-
Tell whether each of the following actions will increase, decrease, or have no effect on total assets, total liabilities, and total stockholders equity: 1. Declaration of a stock dividend 2....
-
Johanna Marra and Eric Nazzaro began a romantic relationship in October 2013. That previous July, Nazzarro had purchased a duplex that he intended to renovate. Nazzarro rented out the top floor while...
-
The following transactions apply to Baker Co. for 2010, its first year of operations. 1. Issued $60,000 of common stock for cash. 2. Provided $128,000 of services on account. 3. Collected $113,200...
-
Give any statement as an example to explain data manipulation language nature of SQL.?
-
Cherry Cotta makes custom ordered clay pots for residential gardens. Below is cost information regarding its latest job. a. Materials were purchased on account. $18,996 purchased b. A materials...
-
Conceptual Question 17.9 (Figure 1) shows the light intensity on a viewing screen behind a single slit of width a. The light's wavelength is A. Figure 1 of 1 Part A Is A a, or is it not possible to...
-
Critically comment on the following statements as they refer to middle-income developing countries "Cyclical and chronic overvaluations can be explained in the context of a floating or fully...
-
(c) Given the following array for the tree representation of UnionFind sets: index D J K treeParent[] B K A B C C C C E D F G H F D K | H i) draw the corresponding trees. ii) what do the operations...
-
On 1 Jan 2021 the computer that Mohan uses in his business refused to start. It would have cost $3,500 to have it repaired. Instead, Mohan installed a new computer costing $4,000 on 1 May 2021. On...
-
You are given the state of a Tic-Tac-Toe game represented as follows: X O X O X The game is played on a 3x3 board. 'X' represents Player 1, and 'O' represents Player 2. An empty cell is represented...
-
Can someone help me with this and fix this three and NOT make it one pieace of code and fix it as the application explains? Revise the code to incorporate common design patterns to make your code...
-
Which is the correct way to take back privileges from 'user1': REVOKE permission_type TO database.table ON 'user1'@'localhost'; REVOKE permission_type ON database.table TO 'user1'@'localhost'; REVOKE...
-
Refer to Example 9.15. Add the following functionality to this program: Allow the user to enter the cost of a gallon of gas on each trip and use a function, Cost() to calculate the cost of purchasing...
-
Human Factors (Dec. 1988) published a study of color brightness as a body orientation clue. Ninety college students reclining on their backs in the dark were disoriented when positioned on a rotating...
-
Refer to the Environmental Science & Technology (Jan. 2005) study of methyl tert-butyl ether (MTBE) contamination in New Hampshire wells, presented in Exercise 2.21 (p. 37). Data collected for a...
-
Refer to the Alaskan Lichen Radionuclide Baseline Research study, presented in Exercise. In a sample of n = 9 lichen specimens, the researchers found the mean and standard deviation of the amount of...
-
Scientists propose that the first macromolecules in protobionts were a. DNA molecules. b. RNA molecules. c. proteins. d. all of the above.
-
Which of the following function(s) is/are carried out by piRITS or piRISC? a. Inhibits transcription of TEs b. Causes the degradation of TE RNA c. Causes chromosome breakage d. Both a and b are...
-
In the CRISPR-Cas system, what does tracrRNA bind to? a. crRNA and Cas1 protein b. crRNA and Cas2 protein c. crRNA and Cas9 protein d. Cas1 and Cas2 proteins
Study smarter with the SolutionInn App