

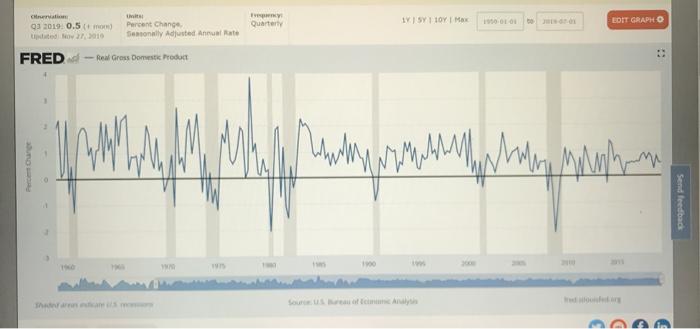
Graph Percentage Change in Real GDP since 1959. On this graph, label any peaks or troughs. Also
Fantastic news! We've Found the answer you've been seeking!
Question:
Graph Percentage Change in Real GDP since 1959. On this graph, label any peaks or troughs. Also indicate on the graph periods of recession, recovery and expansion. [Keep in mind that as long as the percentage change line is above the red zero line, GDP growth was positive meaning the economy was not in a recession or depression.] Do you think business cycles are a major problem in the United States today? Why or why not? Fully explain your position.
9. On the above graph, use a dotted line to predict what you think will happen to Real GDP growth in the next five years (2017-2021). Upon what did you base your prediction? Explain in some detail.
Expert Answer:

Related Book For 

Macroeconomics Principles and Applications
ISBN: 978-1111822354
6th edition
Authors: Robert E. Hall, Marc Lieberman
Posted Date:
