

The current-voltage characteristic or I-V curve is a relationship, typically represented as a chart or graph,...
Fantastic news! We've Found the answer you've been seeking!
Question:
Transcribed Image Text:
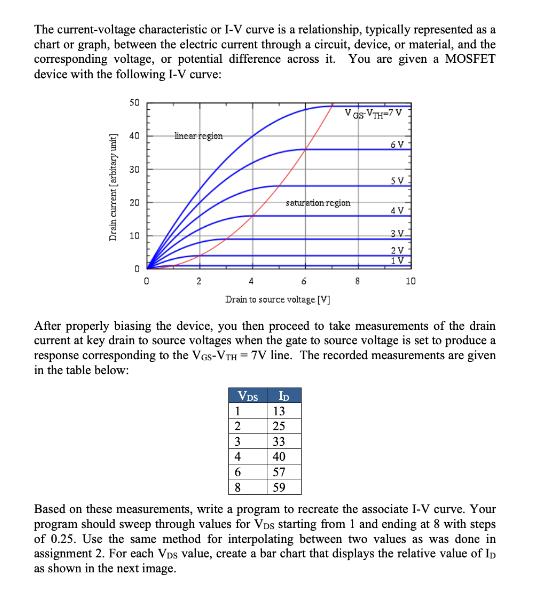
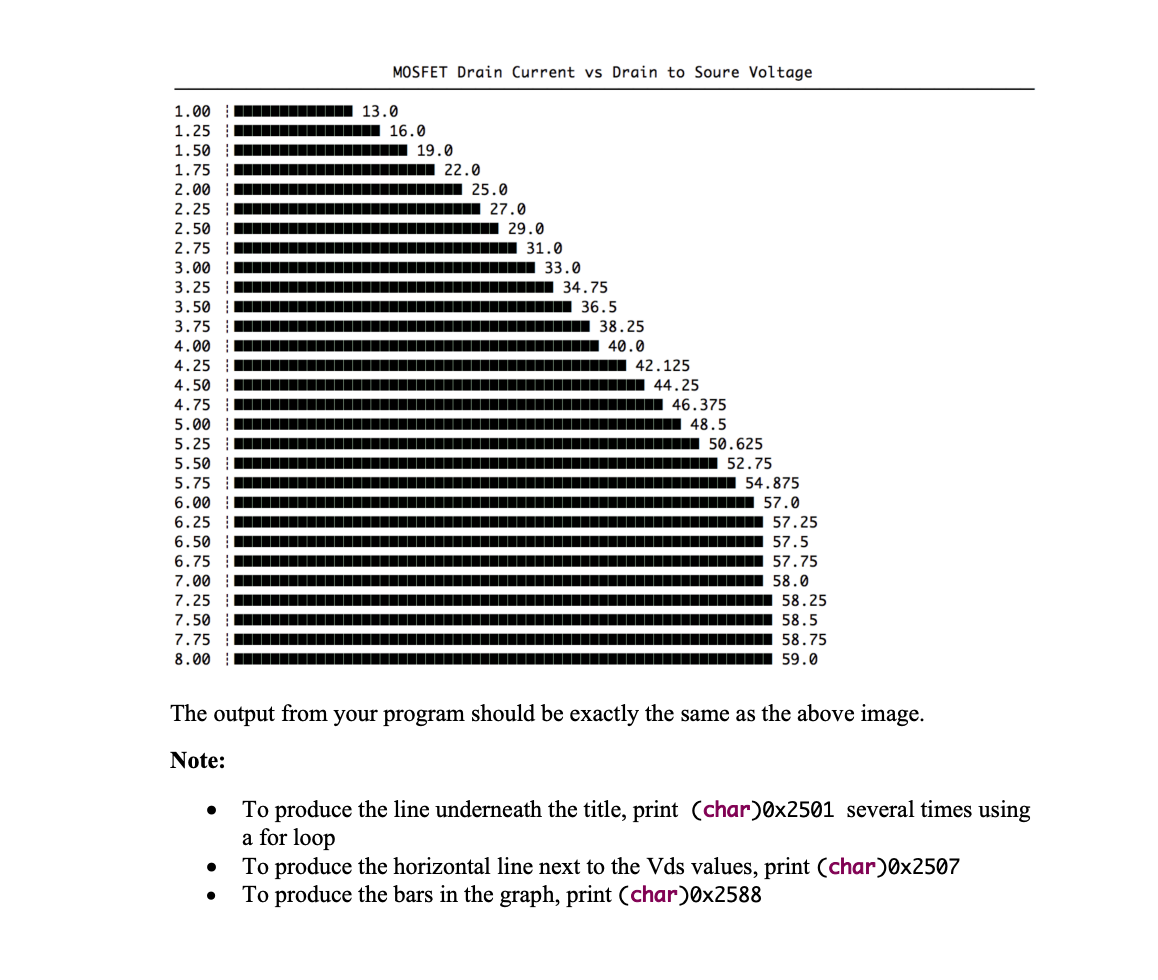
The current-voltage characteristic or I-V curve is a relationship, typically represented as a chart or graph, between the electric current through a circuit, device, or material, and the corresponding voltage, or potential difference across it. You are given a MOSFET device with the following I-V curve: Drain current [arbitary unit] 50 40 30 20 10 0 0 linear region 4 6 Drain to source voltage [V] VDS ID 13 25 1234 saturation region 6 8 Vas-VTH=7 V 33 40 57 59 8 6V After properly biasing the device, you then proceed to take measurements of the drain current at key drain to source voltages when the gate to source voltage is set to produce a response corresponding to the VGS-VTH = 7V line. The recorded measurements are given in the table below: SV 4V 3V 2V 1V 10 Based on these measurements, write a program to recreate the associate I-V curve. Your program should sweep through values for Vos starting from 1 and ending at 8 with steps of 0.25. Use the same method for interpolating between two values as was done in assignment 2. For each Vos value, create a bar chart that displays the relative value of Ip as shown in the next image. 1.00 ▬▬▬▬▬▬▬▬▬▬- 13.0 1.25 1.50 1.75 2.00 2.25 2.50 2.75 3.00 3.25 3.50 3.75 4.00 4.25 4.50 4.75 5.00 5.25 5.50 5.75 6.00 6.25 6.50 6.75 7.00 7.25 7.50 7.75 8.00 MOSFET Drain Current vs Drain to Soure Voltage ● ● ▬▬▬▬▬▬▬▬▬▬▬▬▬▬▬▬▬- 16.0 ▬▬▬▬▬▬▬▬▬▬▬▬▬▬▬▬▬▬▬▬ ▬▬▬▬▬▬▬▬▬▬- 19.0 22.0 ▬▬▬▬▬▬▬▬▬▬▬ 25.0 ▬▬▬▬▬▬▬▬▬▬▬ 27.0 ▬▬▬▬▬▬▬▬▬▬▬ 29.0 31.0 -▬▬▬▬▬▬▬▬▬▬▬▬ 33.0 ▬▬▬▬▬▬▬▬▬▬▬▬▬▬▬▬ ▬▬▬▬▬▬▬▬▬▬▬▬▬▬▬▬▬▬▬▬ 34.75 36.5 38.25 40.0 42.125 ▪▪▪▪▪▪▪▪▪▪▪▪▪▪▪▪▪▪▪▪▪ 44.25 ▬▬▬▬▬▬▬▬▬▬▬ 46.375 48.5 ▬▬▬▬▬▬▬▬▬▬▬ 50.625 52.75 ▬▬▬▬▬▬▬▬▬▬ 54.875 57.0 57.25 ▬▬▬▬▬▬▬▬▬▬▬▬▬▬▬▬▬▬▬▬▬▬ 57.5 The output from your program should be exactly the same as the above image. Note: ▬▬▬▬▬▬▬▬▬▬▬▬▬▬▬▬ 57.75 58.0 ▬▬▬▬▬▬▬▬▬▬▬▬¯¯¯¯¯¯¯¯¯¯¯ 58.25 58.5 58.75 59.0 To produce the line underneath the title, print (char)0x2501 several times using a for loop To produce the horizontal line next to the Vds values, print (char)0x2507 To produce the bars in the graph, print (char)0x2588 The current-voltage characteristic or I-V curve is a relationship, typically represented as a chart or graph, between the electric current through a circuit, device, or material, and the corresponding voltage, or potential difference across it. You are given a MOSFET device with the following I-V curve: Drain current [arbitary unit] 50 40 30 20 10 0 0 linear region 4 6 Drain to source voltage [V] VDS ID 13 25 1234 saturation region 6 8 Vas-VTH=7 V 33 40 57 59 8 6V After properly biasing the device, you then proceed to take measurements of the drain current at key drain to source voltages when the gate to source voltage is set to produce a response corresponding to the VGS-VTH = 7V line. The recorded measurements are given in the table below: SV 4V 3V 2V 1V 10 Based on these measurements, write a program to recreate the associate I-V curve. Your program should sweep through values for Vos starting from 1 and ending at 8 with steps of 0.25. Use the same method for interpolating between two values as was done in assignment 2. For each Vos value, create a bar chart that displays the relative value of Ip as shown in the next image. The current-voltage characteristic or I-V curve is a relationship, typically represented as a chart or graph, between the electric current through a circuit, device, or material, and the corresponding voltage, or potential difference across it. You are given a MOSFET device with the following I-V curve: Drain current [arbitary unit] 50 40 30 20 10 0 0 linear region 4 6 Drain to source voltage [V] VDS ID 13 25 1234 saturation region 6 8 Vas-VTH=7 V 33 40 57 59 8 6V After properly biasing the device, you then proceed to take measurements of the drain current at key drain to source voltages when the gate to source voltage is set to produce a response corresponding to the VGS-VTH = 7V line. The recorded measurements are given in the table below: SV 4V 3V 2V 1V 10 Based on these measurements, write a program to recreate the associate I-V curve. Your program should sweep through values for Vos starting from 1 and ending at 8 with steps of 0.25. Use the same method for interpolating between two values as was done in assignment 2. For each Vos value, create a bar chart that displays the relative value of Ip as shown in the next image. 1.00 ▬▬▬▬▬▬▬▬▬▬- 13.0 1.25 1.50 1.75 2.00 2.25 2.50 2.75 3.00 3.25 3.50 3.75 4.00 4.25 4.50 4.75 5.00 5.25 5.50 5.75 6.00 6.25 6.50 6.75 7.00 7.25 7.50 7.75 8.00 MOSFET Drain Current vs Drain to Soure Voltage ● ● ▬▬▬▬▬▬▬▬▬▬▬▬▬▬▬▬▬- 16.0 ▬▬▬▬▬▬▬▬▬▬▬▬▬▬▬▬▬▬▬▬ ▬▬▬▬▬▬▬▬▬▬- 19.0 22.0 ▬▬▬▬▬▬▬▬▬▬▬ 25.0 ▬▬▬▬▬▬▬▬▬▬▬ 27.0 ▬▬▬▬▬▬▬▬▬▬▬ 29.0 31.0 -▬▬▬▬▬▬▬▬▬▬▬▬ 33.0 ▬▬▬▬▬▬▬▬▬▬▬▬▬▬▬▬ ▬▬▬▬▬▬▬▬▬▬▬▬▬▬▬▬▬▬▬▬ 34.75 36.5 38.25 40.0 42.125 ▪▪▪▪▪▪▪▪▪▪▪▪▪▪▪▪▪▪▪▪▪ 44.25 ▬▬▬▬▬▬▬▬▬▬▬ 46.375 48.5 ▬▬▬▬▬▬▬▬▬▬▬ 50.625 52.75 ▬▬▬▬▬▬▬▬▬▬ 54.875 57.0 57.25 ▬▬▬▬▬▬▬▬▬▬▬▬▬▬▬▬▬▬▬▬▬▬ 57.5 The output from your program should be exactly the same as the above image. Note: ▬▬▬▬▬▬▬▬▬▬▬▬▬▬▬▬ 57.75 58.0 ▬▬▬▬▬▬▬▬▬▬▬▬¯¯¯¯¯¯¯¯¯¯¯ 58.25 58.5 58.75 59.0 To produce the line underneath the title, print (char)0x2501 several times using a for loop To produce the horizontal line next to the Vds values, print (char)0x2507 To produce the bars in the graph, print (char)0x2588 1.00 ▬▬▬▬▬▬▬▬▬▬- 13.0 1.25 1.50 1.75 2.00 2.25 2.50 2.75 3.00 3.25 3.50 3.75 4.00 4.25 4.50 4.75 5.00 5.25 5.50 5.75 6.00 6.25 6.50 6.75 7.00 7.25 7.50 7.75 8.00 MOSFET Drain Current vs Drain to Soure Voltage ● ● ▬▬▬▬▬▬▬▬▬▬▬▬▬▬▬▬▬- 16.0 ▬▬▬▬▬▬▬▬▬▬▬▬▬▬▬▬▬▬▬▬ ▬▬▬▬▬▬▬▬▬▬- 19.0 22.0 ▬▬▬▬▬▬▬▬▬▬▬ 25.0 ▬▬▬▬▬▬▬▬▬▬▬ 27.0 ▬▬▬▬▬▬▬▬▬▬▬ 29.0 31.0 -▬▬▬▬▬▬▬▬▬▬▬▬ 33.0 ▬▬▬▬▬▬▬▬▬▬▬▬▬▬▬▬ ▬▬▬▬▬▬▬▬▬▬▬▬▬▬▬▬▬▬▬▬ 34.75 36.5 38.25 40.0 42.125 ▪▪▪▪▪▪▪▪▪▪▪▪▪▪▪▪▪▪▪▪▪ 44.25 ▬▬▬▬▬▬▬▬▬▬▬ 46.375 48.5 ▬▬▬▬▬▬▬▬▬▬▬ 50.625 52.75 ▬▬▬▬▬▬▬▬▬▬ 54.875 57.0 57.25 ▬▬▬▬▬▬▬▬▬▬▬▬▬▬▬▬▬▬▬▬▬▬ 57.5 The output from your program should be exactly the same as the above image. Note: ▬▬▬▬▬▬▬▬▬▬▬▬▬▬▬▬ 57.75 58.0 ▬▬▬▬▬▬▬▬▬▬▬▬¯¯¯¯¯¯¯¯¯¯¯ 58.25 58.5 58.75 59.0 To produce the line underneath the title, print (char)0x2501 several times using a for loop To produce the horizontal line next to the Vds values, print (char)0x2507 To produce the bars in the graph, print (char)0x2588
Expert Answer:
Answer rating: 100% (QA)
Answer include include int main double VDS 1 2 3 4 5 6 7 8 do... View the full answer

Related Book For 

Microeconomics An Intuitive Approach with Calculus
ISBN: 978-0538453257
1st edition
Authors: Thomas Nechyba
Posted Date:
Students also viewed these programming questions
-
Multinational oil company ExxonMobil faced many challenges related to climate change. Climate change is taking place because of the greenhouse effect. When solar radiation passes through the...
-
Display the information about the managers and clerks from the column Job in the table emp, order the result by deptno. EMPNO ENAME 7369 SMITH 7499 ALLEN 7521 WARD 7566 JONES 7654 MARTIN 7698 BLAKE...
-
Question Description RangeFilterTester.java import java.util.ArrayList; class RangeFilterTester { public static void main( String[] args) { ArrayList accounts = new ArrayList(); accounts.add(new...
-
LeAnn Bryant's cheque book lists the following: The November bank statement shows: Requirement Prepare Bryant's bank reconciliation at November 30. Date Cheque No Item Cheque Deposit Balance Direct...
-
1.) Give your projections on where the economy is heading as we finish the second year of the COVID-19 pandemic. Be sure to include your take on employment, private investment, home starts,...
-
The balance sheet data for Bobs Electronics, Co., November 30, 2010, follow: Requirement 1. The following are three independent assumptions about the business during November. For each assumption,...
-
Macon County Landfill Corp. applied for permission to expand the boundaries of its landfill. Tate and others opposed the application. After a number of hearings, the appropriate agency granted the...
-
Fractional Factorial Project 1 Assignment Investigate the performance of an injection-molding machine used in the manufacturing operations of the Mouse Factory. The response (output) variable is...
-
Computer Project Exercises In developing the exercises, trade-offs had to be made to enrich the learning experience. One of the major problems students initially encounter is data and detail...
-
The income statement a. Is a financial report which makes up the financial statements of a corporation, that lists revenues, subtracts expenses, and arrives at a net income b. Must always show a...
-
Analyze the car marker brand Tesla: Q1: Its brand health equity and competitive comparison using perceptual map Q2: Identify winners and losers, and reason why Q3:Which repositioning decisions would...
-
Based upon the following table, what is the marginal utility of the 3rd unit consumed? Unit # Marginal Utility Total Utility 1 st 75 utils 75 utils 2 nd 55 " 130 " 3 rd ? " 170 " A) 20 utils B) 30...
-
How has globalization influenced the homogenization of cultures, and what are the potential implications for cultural diversity and local traditions ? Explain
-
As a health care manager, it is important to understand and explore methods to advocate for change within the industry through policy analysis. It is also important to be able to navigate the...
-
How has capitalism impacted public health systems in South Asia?
-
Consider the following international investment opportunity: The current exchange rate is $1.60 = 1.00. The inflation rate in the U.S. is 3 percent and in the eurozone 2 percent. The appropriate cost...
-
Before the 1973 oil embargo and subsequent increases in the price of crude oil, gasoline usage in the United States had grown at a seasonally adjusted rate of 0.57 percent per month, with a standard...
-
Suppose two players are asked to split $100 in a way that is agreeable to both. A: The structure for the game is as follows: Player 1moves firstand he is asked to simply state some number between...
-
In the Hollywood movie A Beautiful Mind, Russel Crowe plays John Nash who developed the Nash Equilibrium concept in his PhD thesis at Princeton University. In one of the early scenes of the movie,...
-
Public policy makers are often pressured to reduce class size in public schools in order to raise student achievement. A: One way to model the production process for student achievement is to view...
-
Eleven cubic meters per second of water are diverted through ports in the bottom of the channel between sections (1) and (2). Neglecting head losses and assuming a horizontal channel, what depth of...
-
A partially open sluice gate in a 5 -m-wide rectangular channel carries water at \(10 \mathrm{~m}^{3} / \mathrm{s}\). The upstream depth is \(2.5 \mathrm{~m}\). Find the downstream depth and Froude...
-
A rectangular channel \(10 \mathrm{ft}\) wide carries \(100 \mathrm{cfs}\) on a horizontal bed at \(1.0 \mathrm{ft}\) depth. A smooth bump across the channel rises \(4 \mathrm{in}\). above the...

Study smarter with the SolutionInn App