

e-Gadget Production (2013) Most common companies that sell electronic devices do not handle their own manufacturing....
Fantastic news! We've Found the answer you've been seeking!
Question:
Transcribed Image Text:
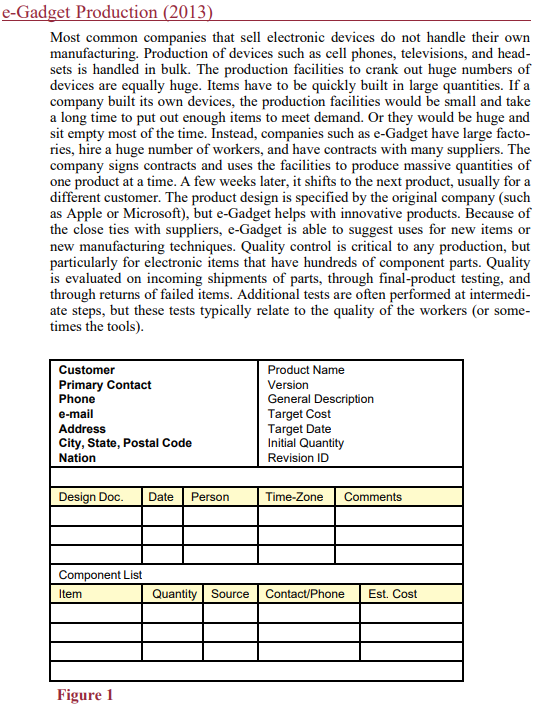
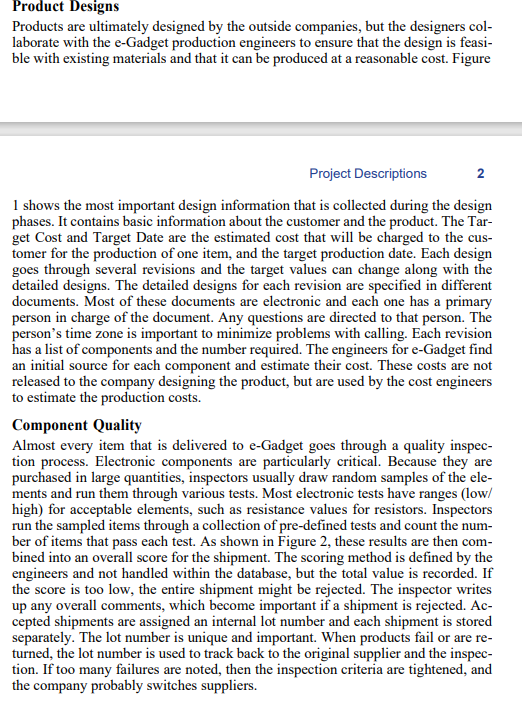
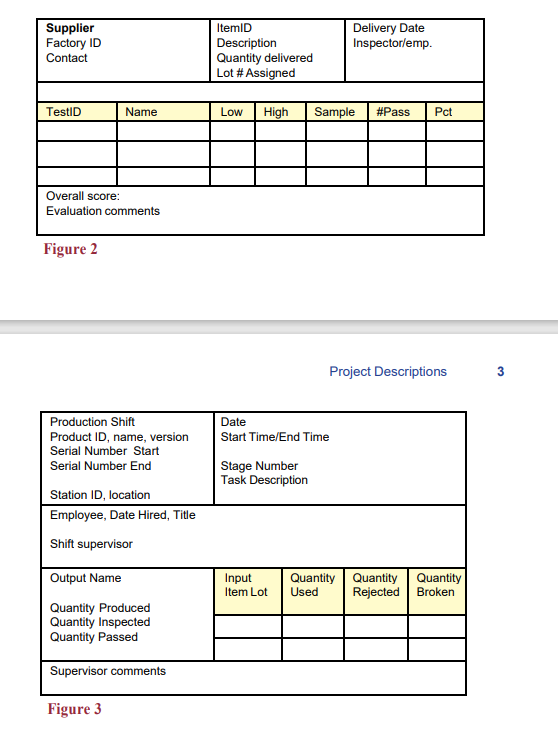
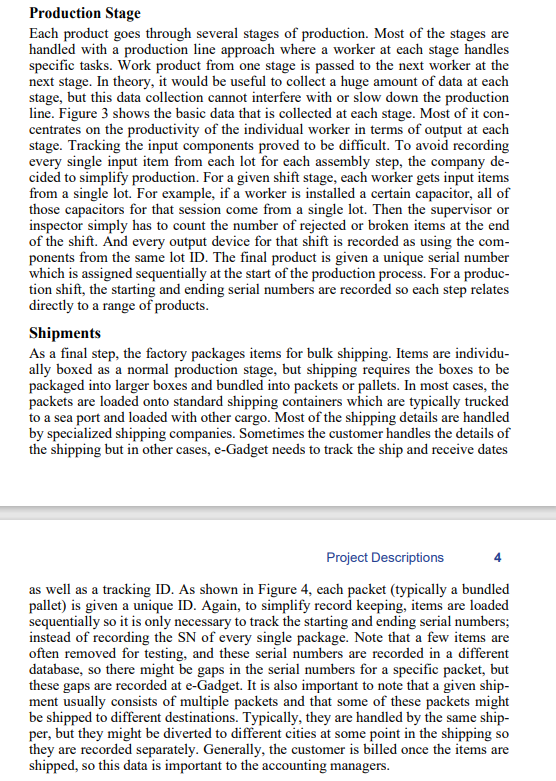
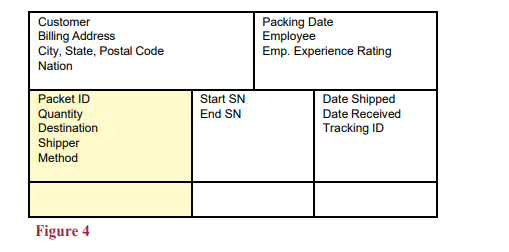
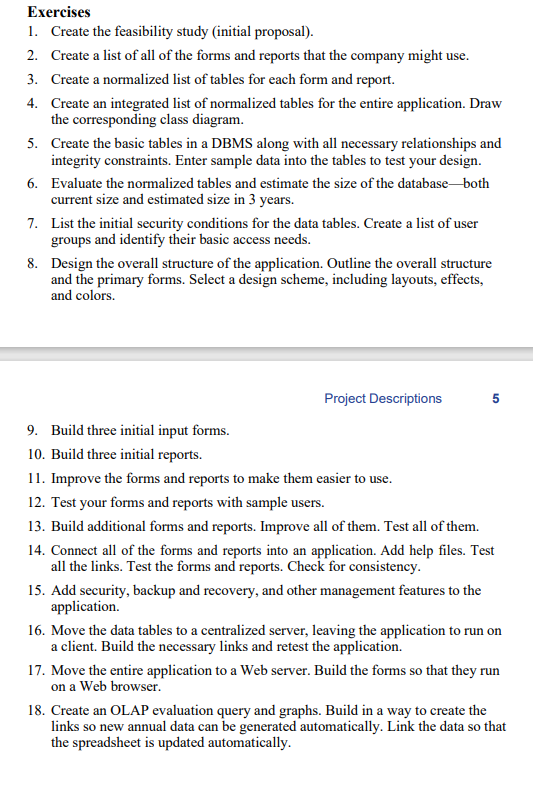
e-Gadget Production (2013) Most common companies that sell electronic devices do not handle their own manufacturing. Production of devices such as cell phones, televisions, and head- sets is handled in bulk. The production facilities to crank out huge numbers of devices are equally huge. Items have to be quickly built in large quantities. If a company built its own devices, the production facilities would be small and take a long time to put out enough items to meet demand. Or they would be huge and sit empty most of the time. Instead, companies such as e-Gadget have large facto- ries, hire a huge number of workers, and have contracts with many suppliers. The company signs contracts and uses the facilities to produce massive quantities of one product at a time. A few weeks later, it shifts to the next product, usually for a different customer. The product design is specified by the original company (such as Apple or Microsoft), but e-Gadget helps with innovative products. Because of the close ties with suppliers, e-Gadget is able to suggest uses for new items or new manufacturing techniques. Quality control is critical to any production, but particularly for electronic items that have hundreds of component parts. Quality is evaluated on incoming shipments of parts, through final-product testing, and through returns of failed items. Additional tests are often performed at intermedi- ate steps, but these tests typically relate to the quality of the workers (or some- times the tools). Customer Primary Contact Phone e-mail Address City, State, Postal Code Nation Design Doc. Date Person Component List Item Figure 1 Quantity Source Product Name Version General Description Target Cost Target Date Initial Quantity Revision ID Time-Zone Comments Contact/Phone Est. Cost Product Designs Products are ultimately designed by the outside companies, but the designers col- laborate with the e-Gadget production engineers to ensure that the design is feasi- ble with existing materials and that it can be produced at a reasonable cost. Figure Project Descriptions 1 shows the most important design information that is collected during the design phases. It contains basic information about the customer and the product. The Tar- get Cost and Target Date are the estimated cost that will be charged to the cus- tomer for the production of one item, and the target production date. Each design goes through several revisions and the target values can change along with the detailed designs. The detailed designs for each revision are specified in different documents. Most of these documents are electronic and each one has a primary person in charge of the document. Any questions are directed to that person. The person's time zone is important to minimize problems with calling. Each revision has a list of components and the number required. The engineers for e-Gadget find an initial source for each component and estimate their cost. These costs are not released to the company designing the product, but are used by the cost engineers to estimate the production costs. 2 Component Quality Almost every item that is delivered to e-Gadget goes through a quality inspec- tion process. Electronic components are particularly critical. Because they are purchased in large quantities, inspectors usually draw random samples of the ele- ments and run them through various tests. Most electronic tests have ranges (low/ high) for acceptable elements, such as resistance values for resistors. Inspectors run the sampled items through a collection of pre-defined tests and count the num- ber of items that pass each test. As shown in Figure 2, these results are then com- bined into an overall score for the shipment. The scoring method is defined by the engineers and not handled within the database, but the total value is recorded. If the score is too low, the entire shipment might be rejected. The inspector writes up any overall comments, which become important if a shipment is rejected. Ac- cepted shipments are assigned an internal lot number and each shipment is stored separately. The lot number is unique and important. When products fail or are re- turned, the lot number is used to track back to the original supplier and the inspec- tion. If too many failures are noted, then the inspection criteria are tightened, and the company probably switches suppliers. Supplier Factory ID Contact TestID Name Overall score: Evaluation comments Figure 2 Production Shift Product ID, name, version Serial Number Start Serial Number End Station ID, location Employee, Date Hired, Title Shift supervisor Output Name Quantity Produced Quantity Inspected Quantity Passed Supervisor comments Figure 3 ItemID Description Quantity delivered Lot # Assigned Low High Date Start Time/End Time Stage Number Task Description Input Item Lot Sample Delivery Date Inspector/emp. Quantity Used #Pass Pct Project Descriptions Quantity Quantity Rejected Broken 3 Production Stage Each product goes through several stages of production. Most of the stages are handled with a production line approach where a worker at each stage handles specific tasks. Work product from one stage is passed to the next worker at the next stage. In theory, it would be useful to collect a huge amount of data at each stage, but this data collection cannot interfere with or slow down the production line. Figure 3 shows the basic data that is collected at each stage. Most of it con- centrates on the productivity of the individual worker in terms of output at each stage. Tracking the input components proved to be difficult. To avoid recording every single input item from each lot for each assembly step, the company de- cided to simplify production. For a given shift stage, each worker gets input items from a single lot. For example, if a worker is installed a certain capacitor, all of those capacitors for that session come from a single lot. Then the supervisor or inspector simply has to count the number of rejected or broken items at the end of the shift. And every output device for that shift is recorded as using the com- ponents from the same lot ID. The final product is given a unique serial number which is assigned sequentially at the start of the production process. For a produc- tion shift, the starting and ending serial numbers are recorded so each step relates directly to a range of products. Shipments As a final step, the factory packages items for bulk shipping. Items are individu- ally boxed as a normal production stage, but shipping requires the boxes to be packaged into larger boxes and bundled into packets or pallets. In most cases, the packets are loaded onto standard shipping containers which are typically trucked to a sea port and loaded with other cargo. Most of the shipping details are handled by specialized shipping companies. Sometimes the customer handles the details of the shipping but in other cases, e-Gadget needs to track the ship and receive dates Project Descriptions as well as a tracking ID. As shown in Figure 4, each packet (typically a bundled pallet) is given a unique ID. Again, to simplify record keeping, items are loaded sequentially so it is only necessary to track the starting and ending serial numbers; instead of recording the SN of every single package. Note that a few items are often removed for testing, and these serial numbers are recorded in a different database, so there might be gaps in the serial numbers for a specific packet, but these gaps are recorded at e-Gadget. It is also important to note that a given ship- ment usually consists of multiple packets and that some of these packets might be shipped to different destinations. Typically, they are handled by the same ship- per, but they might be diverted to different cities at some point in the shipping so they are recorded separately. Generally, the customer is billed once the items are shipped, so this data is important to the accounting managers. Customer Billing Address City, State, Postal Code Nation Packet ID Quantity Destination Shipper Method Figure 4 Start SN End SN Packing Date Employee Emp. Experience Rating Date Shipped Date Received Tracking ID Exercises 1. Create the feasibility study (initial proposal). 2. Create a list of all of the forms and reports that the company might use. 3. Create a normalized list of tables for each form and report. 4. Create an integrated list of normalized tables for the entire application. Draw the corresponding class diagram. 5. Create the basic tables in a DBMS along with all necessary relationships and integrity constraints. Enter sample data into the tables to test your design. 6. Evaluate the normalized tables and estimate the size of the database-both current size and estimated size in 3 years. 7. List the initial security conditions for the data tables. Create a list of user groups and identify their basic access needs. 8. Design the overall structure of the application. Outline the overall structure and the primary forms. Select a design scheme, including layouts, effects, and colors. Project Descriptions 5 9. Build three initial input forms. 10. Build three initial reports. 11. Improve the forms and reports to make them easier to use. 12. Test your forms and reports with sample users. 13. Build additional forms and reports. Improve all of them. Test all of them. 14. Connect all of the forms and reports into an application. Add help files. Test all the links. Test the forms and reports. Check for consistency. 15. Add security, backup and recovery, and other management features to the application. 16. Move the data tables to a centralized server, leaving the application to run on a client. Build the necessary links and retest the application. 17. Move the entire application to a Web server. Build the forms so that they run on a Web browser. 18. Create an OLAP evaluation query and graphs. Build in a way to create the links so new annual data can be generated automatically. Link the data so that the spreadsheet is updated automatically. e-Gadget Production (2013) Most common companies that sell electronic devices do not handle their own manufacturing. Production of devices such as cell phones, televisions, and head- sets is handled in bulk. The production facilities to crank out huge numbers of devices are equally huge. Items have to be quickly built in large quantities. If a company built its own devices, the production facilities would be small and take a long time to put out enough items to meet demand. Or they would be huge and sit empty most of the time. Instead, companies such as e-Gadget have large facto- ries, hire a huge number of workers, and have contracts with many suppliers. The company signs contracts and uses the facilities to produce massive quantities of one product at a time. A few weeks later, it shifts to the next product, usually for a different customer. The product design is specified by the original company (such as Apple or Microsoft), but e-Gadget helps with innovative products. Because of the close ties with suppliers, e-Gadget is able to suggest uses for new items or new manufacturing techniques. Quality control is critical to any production, but particularly for electronic items that have hundreds of component parts. Quality is evaluated on incoming shipments of parts, through final-product testing, and through returns of failed items. Additional tests are often performed at intermedi- ate steps, but these tests typically relate to the quality of the workers (or some- times the tools). Customer Primary Contact Phone e-mail Address City, State, Postal Code Nation Design Doc. Date Person Component List Item Figure 1 Quantity Source Product Name Version General Description Target Cost Target Date Initial Quantity Revision ID Time-Zone Comments Contact/Phone Est. Cost Product Designs Products are ultimately designed by the outside companies, but the designers col- laborate with the e-Gadget production engineers to ensure that the design is feasi- ble with existing materials and that it can be produced at a reasonable cost. Figure Project Descriptions 1 shows the most important design information that is collected during the design phases. It contains basic information about the customer and the product. The Tar- get Cost and Target Date are the estimated cost that will be charged to the cus- tomer for the production of one item, and the target production date. Each design goes through several revisions and the target values can change along with the detailed designs. The detailed designs for each revision are specified in different documents. Most of these documents are electronic and each one has a primary person in charge of the document. Any questions are directed to that person. The person's time zone is important to minimize problems with calling. Each revision has a list of components and the number required. The engineers for e-Gadget find an initial source for each component and estimate their cost. These costs are not released to the company designing the product, but are used by the cost engineers to estimate the production costs. 2 Component Quality Almost every item that is delivered to e-Gadget goes through a quality inspec- tion process. Electronic components are particularly critical. Because they are purchased in large quantities, inspectors usually draw random samples of the ele- ments and run them through various tests. Most electronic tests have ranges (low/ high) for acceptable elements, such as resistance values for resistors. Inspectors run the sampled items through a collection of pre-defined tests and count the num- ber of items that pass each test. As shown in Figure 2, these results are then com- bined into an overall score for the shipment. The scoring method is defined by the engineers and not handled within the database, but the total value is recorded. If the score is too low, the entire shipment might be rejected. The inspector writes up any overall comments, which become important if a shipment is rejected. Ac- cepted shipments are assigned an internal lot number and each shipment is stored separately. The lot number is unique and important. When products fail or are re- turned, the lot number is used to track back to the original supplier and the inspec- tion. If too many failures are noted, then the inspection criteria are tightened, and the company probably switches suppliers. Supplier Factory ID Contact TestID Name Overall score: Evaluation comments Figure 2 Production Shift Product ID, name, version Serial Number Start Serial Number End Station ID, location Employee, Date Hired, Title Shift supervisor Output Name Quantity Produced Quantity Inspected Quantity Passed Supervisor comments Figure 3 ItemID Description Quantity delivered Lot # Assigned Low High Date Start Time/End Time Stage Number Task Description Input Item Lot Sample Delivery Date Inspector/emp. Quantity Used #Pass Pct Project Descriptions Quantity Quantity Rejected Broken 3 Production Stage Each product goes through several stages of production. Most of the stages are handled with a production line approach where a worker at each stage handles specific tasks. Work product from one stage is passed to the next worker at the next stage. In theory, it would be useful to collect a huge amount of data at each stage, but this data collection cannot interfere with or slow down the production line. Figure 3 shows the basic data that is collected at each stage. Most of it con- centrates on the productivity of the individual worker in terms of output at each stage. Tracking the input components proved to be difficult. To avoid recording every single input item from each lot for each assembly step, the company de- cided to simplify production. For a given shift stage, each worker gets input items from a single lot. For example, if a worker is installed a certain capacitor, all of those capacitors for that session come from a single lot. Then the supervisor or inspector simply has to count the number of rejected or broken items at the end of the shift. And every output device for that shift is recorded as using the com- ponents from the same lot ID. The final product is given a unique serial number which is assigned sequentially at the start of the production process. For a produc- tion shift, the starting and ending serial numbers are recorded so each step relates directly to a range of products. Shipments As a final step, the factory packages items for bulk shipping. Items are individu- ally boxed as a normal production stage, but shipping requires the boxes to be packaged into larger boxes and bundled into packets or pallets. In most cases, the packets are loaded onto standard shipping containers which are typically trucked to a sea port and loaded with other cargo. Most of the shipping details are handled by specialized shipping companies. Sometimes the customer handles the details of the shipping but in other cases, e-Gadget needs to track the ship and receive dates Project Descriptions as well as a tracking ID. As shown in Figure 4, each packet (typically a bundled pallet) is given a unique ID. Again, to simplify record keeping, items are loaded sequentially so it is only necessary to track the starting and ending serial numbers; instead of recording the SN of every single package. Note that a few items are often removed for testing, and these serial numbers are recorded in a different database, so there might be gaps in the serial numbers for a specific packet, but these gaps are recorded at e-Gadget. It is also important to note that a given ship- ment usually consists of multiple packets and that some of these packets might be shipped to different destinations. Typically, they are handled by the same ship- per, but they might be diverted to different cities at some point in the shipping so they are recorded separately. Generally, the customer is billed once the items are shipped, so this data is important to the accounting managers. Customer Billing Address City, State, Postal Code Nation Packet ID Quantity Destination Shipper Method Figure 4 Start SN End SN Packing Date Employee Emp. Experience Rating Date Shipped Date Received Tracking ID Exercises 1. Create the feasibility study (initial proposal). 2. Create a list of all of the forms and reports that the company might use. 3. Create a normalized list of tables for each form and report. 4. Create an integrated list of normalized tables for the entire application. Draw the corresponding class diagram. 5. Create the basic tables in a DBMS along with all necessary relationships and integrity constraints. Enter sample data into the tables to test your design. 6. Evaluate the normalized tables and estimate the size of the database-both current size and estimated size in 3 years. 7. List the initial security conditions for the data tables. Create a list of user groups and identify their basic access needs. 8. Design the overall structure of the application. Outline the overall structure and the primary forms. Select a design scheme, including layouts, effects, and colors. Project Descriptions 5 9. Build three initial input forms. 10. Build three initial reports. 11. Improve the forms and reports to make them easier to use. 12. Test your forms and reports with sample users. 13. Build additional forms and reports. Improve all of them. Test all of them. 14. Connect all of the forms and reports into an application. Add help files. Test all the links. Test the forms and reports. Check for consistency. 15. Add security, backup and recovery, and other management features to the application. 16. Move the data tables to a centralized server, leaving the application to run on a client. Build the necessary links and retest the application. 17. Move the entire application to a Web server. Build the forms so that they run on a Web browser. 18. Create an OLAP evaluation query and graphs. Build in a way to create the links so new annual data can be generated automatically. Link the data so that the spreadsheet is updated automatically.
Expert Answer:
Answer rating: 100% (QA)
Here are the responses to the exercises 1 Feasibility Study Initial Proposal Provide an overview of the eGadget production process and the need for a comprehensive information system Outline the key o... View the full answer

Related Book For 

International Marketing And Export Management
ISBN: 9781292016924
8th Edition
Authors: Gerald Albaum , Alexander Josiassen , Edwin Duerr
Posted Date:
Students also viewed these general management questions
-
(Using C++) Create the Person class. Create some objects of this class (by taking information from the user). Inherit the class Person to create two classes Teacher and Student class. Maintain the...
-
Googles ease of use and superior search results have propelled the search engine to its num- ber one status, ousting the early dominance of competitors such as WebCrawler and Infos- eek. Even later...
-
Planning is one of the most important management functions in any business. A front office managers first step in planning should involve determine the departments goals. Planning also includes...
-
How to get a good answer using data and analysis tools in jmp 1 uses the other variables to predict "passion." passion would need to be aggregated into high/low first, and then you can use logistic...
-
Where is the fovea centralis, and why is it important?
-
By inspection, solve the equation Explain your reasoning. 0 76 5+0 x00
-
The chapter says that a measurement system can affect society in several ways. As an example, consider the use of GMAT scores in the United States. A. Do they shape how people think about the ability...
-
The following data relate to the operations of Slick Software, Inc., during 2018. Continuing operations: Net...
-
A company provides the following information related to key relationships in financial accounting. Given Information: Revenues Expenses Beginning Retained Earnings Dividends Liabilities Common Stock...
-
As the manager of credit card services at Bank of Hanover (BOH), you're aware that the average profitability of a credit card customer grows with the number of years they have used the credit card....
-
Helix Company is approached by a new customer to provide 1,680 units of its product at a special price of $6 per unit. The normal selling price of the product is $8 per unit. Helix is operating at...
-
True or False. The spectrum analyzers are also known as fast Fourier transform (FFT) analyzers.
-
True or False. The damping ratio of a vibrating system can be found from the Bode diagram.
-
True or False. The complete dynamic response of a machine can be determined through modal testing.
-
True or False. A spectrum analyzer is a device that analyzes a signal in the frequency domain.
-
Fill in the Blank. A device that transforms values of physical variables into equivalent electrical signals is called a(n) _____________ .
-
! Required information Use the following information for Exercises 25-27 below. (Algo) [The following information applies to the questions displayed below.] Carmen Camry operates a consulting firm...
-
H Corporation has a bond outstanding. It has a coupon rate of 8 percent and a $1000 par value. The bond has 6 years left to maturity but could be called after three years for $1000 plus a call...
-
Various classification schemes are sometimes used to given an indication of the potential of a foreign market/country. Explain why these schemes should or should not be used as a basis for deciding...
-
In 2010, Avon was still in the process of rebuilding its marketing operations in China after the turmoil caused by the Chinese governments ban on direct selling in 1998. The imposition of this ban...
-
A professor and her husband, while on vacation in eastern Europe, found some beautifully handcrafted, fired-clay figurines for sale in Budapest. Displayed by the artist in a stall in a small open...
-
How does using different scenarios differ from simple cash flow discounting?
-
In a simplified form, can the Monte Carlo method be implemented without a computer?
-
The group Lagardre states in its annual report that the rate used to measure the cost of capital is the discount rate which is equal to the flow of net future dividends (excluding tax credits) at the...

Study smarter with the SolutionInn App