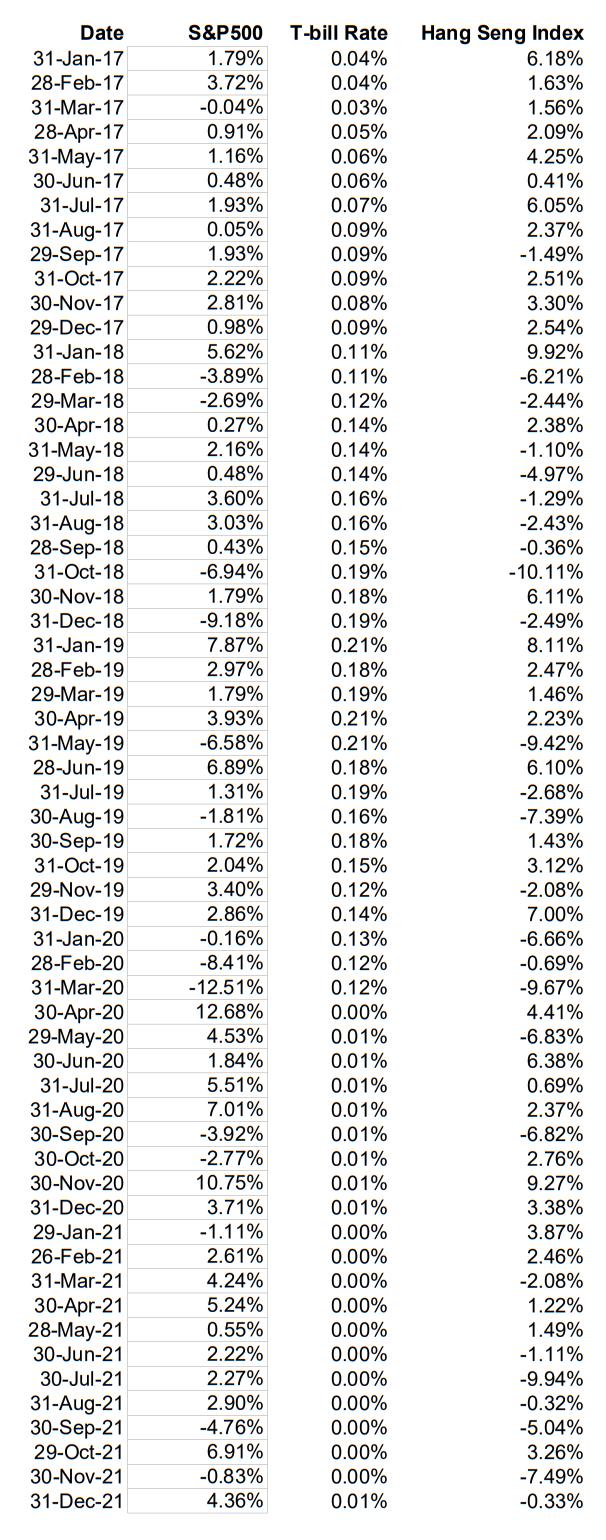
Estimate the Sharpe ratio of S&P 500 and Hang Seng Index. Use the average U.S. Treasury...
Fantastic news! We've Found the answer you've been seeking!
Question:
Transcribed Image Text:
Estimate the Sharpe ratio of S&P 500 and Hang Seng Index. Use the average U.S. Treasury bill rate as the estimate of the riskfree rate. Date 31-Jan-17 28-Feb-17 31-Mar-17 28-Apr-17 31-May-17 30-Jun-17 31-Jul-17 31-Aug-17 29-Sep-17 31-Oct-17 30-Nov-17 29-Dec-17 31-Jan-18 28-Feb-18 29-Mar-18 30-Apr-18 31-May-18 29-Jun-18 31-Jul-18 31-Aug-18 28-Sep-18 31-Oct-18 30-Nov-18 31-Dec-18 31-Jan-19 28-Feb-19 29-Mar-19 30-Apr-19 31-May-19 28-Jun-19 31-Jul-19 30-Aug-19 30-Sep-19 31-Oct-19 29-Nov-19 31-Dec-19 31-Jan-20 28-Feb-20 31-Mar-20 30-Apr-20 29-May-20 30-Jun-20 31-Jul-20 31-Aug-20 30-Sep-20 30-Oct-20 30-Nov-20 31-Dec-20 29-Jan-21 26-Feb-21 31-Mar-21 30-Apr-21 28-May-21 30-Jun-21 30-Jul-21 31-Aug-21 30-Sep-21 29-Oct-21 30-Nov-21 31-Dec-21 S&P500 T-bill Rate 1.79% 0.04% 3.72% 0.04% -0.04% 0.03% 0.91% 0.05% 1.16% 0.48% 1.93% 0.05% 1.93% 2.22% 2.81% 0.98% 5.62% -3.89% -2.69% 0.27% 2.16% 0.48% 3.60% 3.03% 0.43% -6.94% 1.79% -9.18% 7.87% 2.97% 1.79% 3.93% -6.58% 6.89% 1.31% -1.81% 1.72% 2.04% 3.40% 2.86% -0.16% -8.41% -12.51% 12.68% 4.53% 1.84% 5.51% 7.01% -3.92% -2.77% 10.75% 3.71% -1.11% 2.61% 4.24% 5.24% 0.55% 2.22% 2.27% 2.90% -4.76% 6.91% -0.83% 4.36% 0.06% 0.06% 0.07% 0.09% 0.09% 0.09% 0.08% 0.09% 0.11% 0.11% 0.12% 0.14% 0.14% 0.14% 0.16% 0.16% 0.15% 0.19% 0.18% 0.19% 0.21% 0.18% 0.19% 0.21% 0.21% 0.18% 0.19% 0.16% 0.18% 0.15% 0.12% 0.14% 0.13% 0.12% 0.12% 0.00% 0.01% 0.01% 0.01% 0.01% 0.01% 0.01% 0.01% 0.01% 0.00% 0.00% 0.00% 0.00% 0.00% 0.00% 0.00% 0.00% 0.00% 0.00% 0.00% 0.01% Hang Seng Index 6.18% 1.63% 1.56% 2.09% 4.25% 0.41% 6.05% 2.37% -1.49% 2.51% 3.30% 2.54% 9.92% -6.21% -2.44% 2.38% -1.10% -4.97% -1.29% -2.43% -0.36% -10.11% 6.11% -2.49% 8.11% 2.47% 1.46% 2.23% -9.42% 6.10% -2.68% -7.39% 1.43% 3.12% -2.08% 7.00% -6.66% -0.69% -9.67% 4.41% -6.83% 6.38% 0.69% 2.37% -6.82% 2.76% 9.27% 3.38% 3.87% 2.46% -2.08% 1.22% 1.49% -1.11% -9.94% -0.32% -5.04% 3.26% -7.49% -0.33% Estimate the Sharpe ratio of S&P 500 and Hang Seng Index. Use the average U.S. Treasury bill rate as the estimate of the riskfree rate. Date 31-Jan-17 28-Feb-17 31-Mar-17 28-Apr-17 31-May-17 30-Jun-17 31-Jul-17 31-Aug-17 29-Sep-17 31-Oct-17 30-Nov-17 29-Dec-17 31-Jan-18 28-Feb-18 29-Mar-18 30-Apr-18 31-May-18 29-Jun-18 31-Jul-18 31-Aug-18 28-Sep-18 31-Oct-18 30-Nov-18 31-Dec-18 31-Jan-19 28-Feb-19 29-Mar-19 30-Apr-19 31-May-19 28-Jun-19 31-Jul-19 30-Aug-19 30-Sep-19 31-Oct-19 29-Nov-19 31-Dec-19 31-Jan-20 28-Feb-20 31-Mar-20 30-Apr-20 29-May-20 30-Jun-20 31-Jul-20 31-Aug-20 30-Sep-20 30-Oct-20 30-Nov-20 31-Dec-20 29-Jan-21 26-Feb-21 31-Mar-21 30-Apr-21 28-May-21 30-Jun-21 30-Jul-21 31-Aug-21 30-Sep-21 29-Oct-21 30-Nov-21 31-Dec-21 S&P500 T-bill Rate 1.79% 0.04% 3.72% 0.04% -0.04% 0.03% 0.91% 0.05% 1.16% 0.48% 1.93% 0.05% 1.93% 2.22% 2.81% 0.98% 5.62% -3.89% -2.69% 0.27% 2.16% 0.48% 3.60% 3.03% 0.43% -6.94% 1.79% -9.18% 7.87% 2.97% 1.79% 3.93% -6.58% 6.89% 1.31% -1.81% 1.72% 2.04% 3.40% 2.86% -0.16% -8.41% -12.51% 12.68% 4.53% 1.84% 5.51% 7.01% -3.92% -2.77% 10.75% 3.71% -1.11% 2.61% 4.24% 5.24% 0.55% 2.22% 2.27% 2.90% -4.76% 6.91% -0.83% 4.36% 0.06% 0.06% 0.07% 0.09% 0.09% 0.09% 0.08% 0.09% 0.11% 0.11% 0.12% 0.14% 0.14% 0.14% 0.16% 0.16% 0.15% 0.19% 0.18% 0.19% 0.21% 0.18% 0.19% 0.21% 0.21% 0.18% 0.19% 0.16% 0.18% 0.15% 0.12% 0.14% 0.13% 0.12% 0.12% 0.00% 0.01% 0.01% 0.01% 0.01% 0.01% 0.01% 0.01% 0.01% 0.00% 0.00% 0.00% 0.00% 0.00% 0.00% 0.00% 0.00% 0.00% 0.00% 0.00% 0.01% Hang Seng Index 6.18% 1.63% 1.56% 2.09% 4.25% 0.41% 6.05% 2.37% -1.49% 2.51% 3.30% 2.54% 9.92% -6.21% -2.44% 2.38% -1.10% -4.97% -1.29% -2.43% -0.36% -10.11% 6.11% -2.49% 8.11% 2.47% 1.46% 2.23% -9.42% 6.10% -2.68% -7.39% 1.43% 3.12% -2.08% 7.00% -6.66% -0.69% -9.67% 4.41% -6.83% 6.38% 0.69% 2.37% -6.82% 2.76% 9.27% 3.38% 3.87% 2.46% -2.08% 1.22% 1.49% -1.11% -9.94% -0.32% -5.04% 3.26% -7.49% -0.33%
Expert Answer:
Answer rating: 100% (QA)
a Average of US Treasury bill rate Date Tbill Rate 31Jan17 004 28Feb17 004 31Mar17 003 28Apr17 005 3... View the full answer
Related Book For
Posted Date:
Students also viewed these finance questions
-
If net operating income is $34,000, average operating assets are $204,000, and the minimum required rate of return is 15%, what is the residual income?
-
The beta of Tasty Foods stock of 1.10 used by Rae in computing the required return on equity was based on monthly returns for the past 10 years. If Rae uses daily returns for the past 5 years, the...
-
The attached spreadsheet "PS2 data" (see photo) contains the time series of monthly market capitalization and return of the S& P 500 Stock Index and the S&P 500 Investment Grade bond Index....
-
Beginning from rest, an object of mass 200 kg slides down a 10-m-long ramp, the ramp is inclined at an angle of 40 from the horizontal. If air resistance and friction between the object and the ramp...
-
Two cases in this chapter, Transatlantic Financing and Bernina Distributors, involved very different facts but similar issues of law. What legal issues do they have in common? In each case there is...
-
What has the company done to adapt to its environment?
-
The equity method is often described as a one-line consolidation. Discuss the similarities of the equity method and consolidated reporting. Discuss how these methods differ in their financial...
-
Refer to the data in Exercise 13-28. Varmit-B-Gone estimates that the number of subscribers in September should fall 10 percent below August levels, and the number of service calls per subscriber...
-
1. Did Tunesha discuss concepts that you have learned in this class? List some of them. 2. What are some of the most striking/memorable stories from the presentation? 3. Is there anything she said...
-
Since its 100% acquisition of Dancer Corporation stock on December 31, 2012, Jones Corporation has maintained its investment under the equity method. However, due to Dancer's earning potential, the...
-
You want to measure how fast you can throw a baseball, but you don't have any fancy equipment to measure the speed of the ball as it leaves your hand. As an expert physics student, you know you can...
-
Analyze a hypothetical real estate transaction involving the purchase of a commercial property. Identify the potential GST/HST implications for both the buyer and the seller. Discuss the property tax...
-
Explain the concept of Helicopter Money, highlighting the difference between Helicopter Money and Quantitative Easing. Does the use of Helicopter Money imply that a Central Bank is not independent,...
-
I want to buy a house in 4 years. I need to have a down payment of $50,000. How much do I need to have today in order to have the down payment, if I can earn 3%?
-
The holding period return on a 90-day security is 1.25%. What is the security's effective annual yield?
-
If you were advising a family member on investing in stocks, what would you highlight? What features of stock investing could people benefit from? If the stock market returns an average of 12%, what...
-
These are system features that are asked to be implemented in the exercise below a. Schedule Technicians b. Obtain part for repair c. Setting up follow up appoints after parts arrive 1. Create WBS a....
-
Differentiate the following terms/concepts: a. Personality types and money attitudes b. Planners and avoiders c. Moderating and adapting to biases d. "Perfectible judges" and "incorrigible judges"
-
A survey of your customers shows, to your surprise, that 42 out of 200 randomly selected customers were not satisfied with after-sale support and service. a. Find the summary statistics: the sample...
-
There is a saying about initial public offerings (IPOs) of stock: If you want it, you cant get it; if you can get it, you dont want it. The reason is that it is often difficult for the general public...
-
How predictable are advertising budgets from year to year? Consider the 2008 and 2009 advertising spending of selected firms as reported in Table 11.3.8. a. Summarize the strength of the year-to-year...
-
What is the case for efficiency and productivity?
-
Do earnings differences reflect discrimination or differences in productivity?
-
How many people live in poverty?
Study smarter with the SolutionInn App