

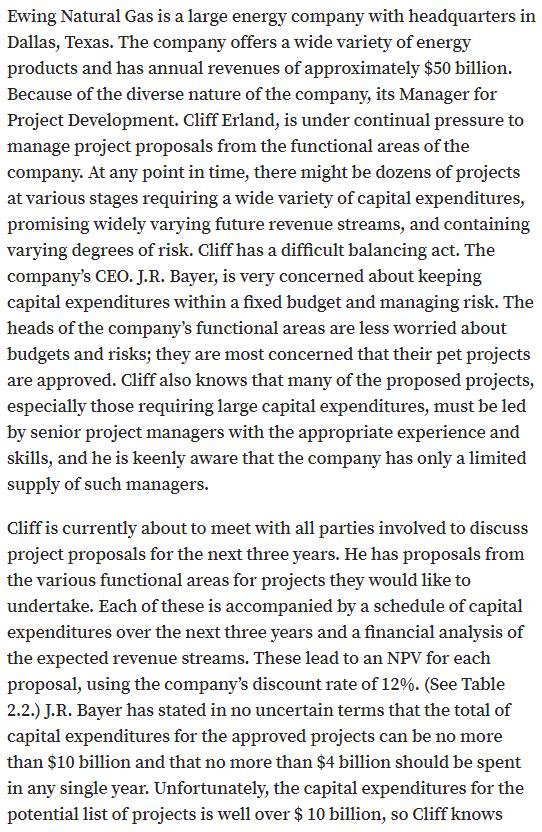
Ewing Natural Gas is a large energy company with headquarters in Dallas, Texas. The company offers...
Fantastic news! We've Found the answer you've been seeking!
Question:
Transcribed Image Text:
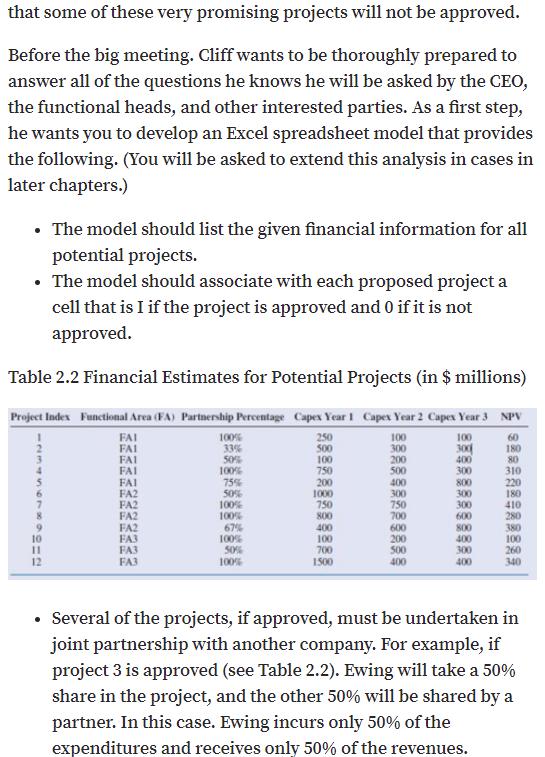
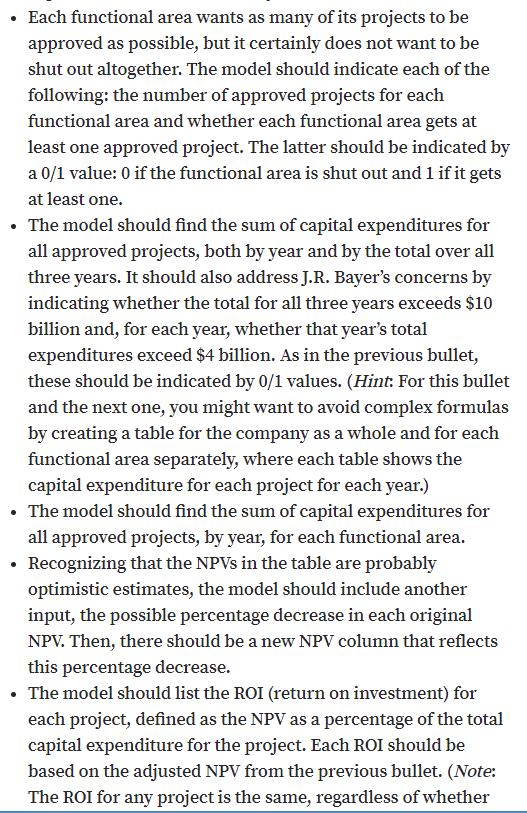
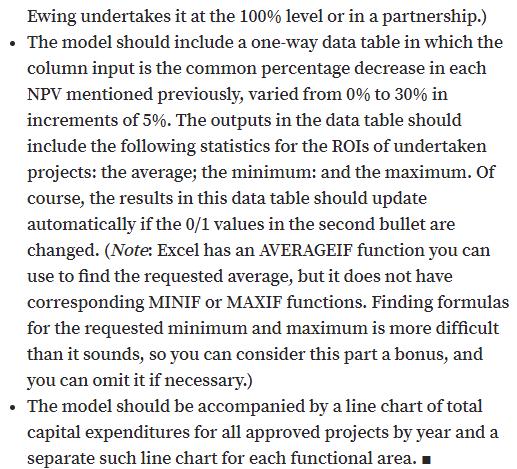
Ewing Natural Gas is a large energy company with headquarters in Dallas, Texas. The company offers a wide variety of energy products and has annual revenues of approximately $50 billion. Because of the diverse nature of the company, its Manager for Project Development. Cliff Erland, is under continual pressure to manage project proposals from the functional areas of the company. At any point in time, there might be dozens of projects at various stages requiring a wide variety of capital expenditures, promising widely varying future revenue streams, and containing varying degrees of risk. Cliff has a difficult balancing act. The company's CEO. J.R. Bayer, is very concerned about keeping capital expenditures within a fixed budget and managing risk. The heads of the company's functional areas are less worried about budgets and risks; they are most concerned that their pet projects are approved. Cliff also knows that many of the proposed projects, especially those requiring large capital expenditures, must be led by senior project managers with the appropriate experience and skills, and he is keenly aware that the company has only a limited supply of such managers. Cliff is currently about to meet with all parties involved to discuss project proposals for the next three years. He has proposals from the various functional areas for projects they would like to undertake. Each of these is accompanied by a schedule of capital expenditures over the next three years and a financial analysis of the expected revenue streams. These lead to an NPV for each proposal, using the company's discount rate of 12%. (See Table 2.2.) J.R. Bayer has stated in no uncertain terms that the total of capital expenditures for the approved projects can be no more than $10 billion and that no more than $4 billion should be spent in any single year. Unfortunately, the capital expenditures for the potential list of projects is well over $ 10 billion, so Cliff knows that some of these very promising projects will not be approved. Before the big meeting. Cliff wants to be thoroughly prepared to answer all of the questions he knows he will be asked by the CEO, the functional heads, and other interested parties. As a first step, he wants you to develop an Excel spreadsheet model that provides the following. (You will be asked to extend this analysis in cases in later chapters.) • The model should list the given financial information for all potential projects. • The model should associate with each proposed project a cell that is I if the project is approved and 0 if it is not approved. Table 2.2 Financial Estimates for Potential Projects (in $ millions) Project Index Functional Area (FA) Partnership Percentage Capex Year 1 Capex Year 2 Capex Year 3 NPV FAI FAI FAI FAI FAI FA2 FA2 FA2 FA2 FA3 FA3 FA3 100% 33% 50% 100% 75% 50% 100% 100% 67% 100% 50% 100% 250 500 100 750 200 00 300 400 60 180 100 300 200 500 80 300 310 220 180 410 280 400 800 1000 300 300 750 750 700 300 600 800 6. 10 400 100 700 1500 600 200 500 400 400 300 400 380 100 260 340 12 • Several of the projects, if approved, must be undertaken in joint partnership with another company. For example, if project 3 is approved (see Table 2.2). Ewing will take a 50% share in the project, and the other 50% will be shared by a partner. In this case. Ewing incurs only 50% of the expenditures and receives only 50% of the revenues. • Each functional area wants as many of its projects to be approved as possible, but it certainly does not want to be shut out altogether. The model should indicate each of the following: the number of approved projects for each functional area and whether each functional area gets at least one approved project. The latter should be indicated by a 0/1 value: 0 if the functional area is shut out and 1 if it gets at least one. • The model should find the sum of capital expenditures for all approved projects, both by year and by the total over all three years. It should also address J.R. Bayer's concerns by indicating whether the total for all three years exceeds $10 billion and, for each year, whether that year's total expenditures exceed $4 billion. As in the previous bullet, these should be indicated by 0/1 values. (Hint: For this bullet and the next one, you might want to avoid complex formulas by creating a table for the company as a whole and for each functional area separately, where each table shows the capital expenditure for each project for each year.) • The model should find the sum of capital expenditures for all approved projects, by year, for each functional area. Recognizing that the NPVS in the table are probably optimistic estimates, the model should include another input, the possible percentage decrease in each original NPV. Then, there should be a new NPV column that reflects this percentage decrease. • The model should list the ROI (return on investment) for each project, defined as the NPV as a percentage of the total capital expenditure for the project. Each ROI should be based on the adjusted NPV from the previous bullet. (Note: The ROI for any project is the same, regardless of whether Ewing undertakes it at the 100% level or in a partnership.) • The model should include a one-way data table in which the column input is the common percentage decrease in each NPV mentioned previously, varied from 0% to 30% in increments of 5%. The outputs in the data table should include the following statistics for the ROIS of undertaken projects: the average; the minimum: and the maximum. Of course, the results in this data table should update automatically if the 0/1 values in the second bullet are changed. (Note: Excel has an AVERAGEIF function you can use to find the requested average, but it does not have corresponding MINIF or MAXIF functions. Finding formulas for the requested minimum and maximum is more difficult than it sounds, so you can consider this part a bonus, and you can omit it if necessary.) The model should be accompanied by a line chart of total capital expenditures for all approved projects by year and a separate such line chart for each functional area. I Ewing Natural Gas is a large energy company with headquarters in Dallas, Texas. The company offers a wide variety of energy products and has annual revenues of approximately $50 billion. Because of the diverse nature of the company, its Manager for Project Development. Cliff Erland, is under continual pressure to manage project proposals from the functional areas of the company. At any point in time, there might be dozens of projects at various stages requiring a wide variety of capital expenditures, promising widely varying future revenue streams, and containing varying degrees of risk. Cliff has a difficult balancing act. The company's CEO. J.R. Bayer, is very concerned about keeping capital expenditures within a fixed budget and managing risk. The heads of the company's functional areas are less worried about budgets and risks; they are most concerned that their pet projects are approved. Cliff also knows that many of the proposed projects, especially those requiring large capital expenditures, must be led by senior project managers with the appropriate experience and skills, and he is keenly aware that the company has only a limited supply of such managers. Cliff is currently about to meet with all parties involved to discuss project proposals for the next three years. He has proposals from the various functional areas for projects they would like to undertake. Each of these is accompanied by a schedule of capital expenditures over the next three years and a financial analysis of the expected revenue streams. These lead to an NPV for each proposal, using the company's discount rate of 12%. (See Table 2.2.) J.R. Bayer has stated in no uncertain terms that the total of capital expenditures for the approved projects can be no more than $10 billion and that no more than $4 billion should be spent in any single year. Unfortunately, the capital expenditures for the potential list of projects is well over $ 10 billion, so Cliff knows that some of these very promising projects will not be approved. Before the big meeting. Cliff wants to be thoroughly prepared to answer all of the questions he knows he will be asked by the CEO, the functional heads, and other interested parties. As a first step, he wants you to develop an Excel spreadsheet model that provides the following. (You will be asked to extend this analysis in cases in later chapters.) • The model should list the given financial information for all potential projects. • The model should associate with each proposed project a cell that is I if the project is approved and 0 if it is not approved. Table 2.2 Financial Estimates for Potential Projects (in $ millions) Project Index Functional Area (FA) Partnership Percentage Capex Year 1 Capex Year 2 Capex Year 3 NPV FAI FAI FAI FAI FAI FA2 FA2 FA2 FA2 FA3 FA3 FA3 100% 33% 50% 100% 75% 50% 100% 100% 67% 100% 50% 100% 250 500 100 750 200 00 300 400 60 180 100 300 200 500 80 300 310 220 180 410 280 400 800 1000 300 300 750 750 700 300 600 800 6. 10 400 100 700 1500 600 200 500 400 400 300 400 380 100 260 340 12 • Several of the projects, if approved, must be undertaken in joint partnership with another company. For example, if project 3 is approved (see Table 2.2). Ewing will take a 50% share in the project, and the other 50% will be shared by a partner. In this case. Ewing incurs only 50% of the expenditures and receives only 50% of the revenues. • Each functional area wants as many of its projects to be approved as possible, but it certainly does not want to be shut out altogether. The model should indicate each of the following: the number of approved projects for each functional area and whether each functional area gets at least one approved project. The latter should be indicated by a 0/1 value: 0 if the functional area is shut out and 1 if it gets at least one. • The model should find the sum of capital expenditures for all approved projects, both by year and by the total over all three years. It should also address J.R. Bayer's concerns by indicating whether the total for all three years exceeds $10 billion and, for each year, whether that year's total expenditures exceed $4 billion. As in the previous bullet, these should be indicated by 0/1 values. (Hint: For this bullet and the next one, you might want to avoid complex formulas by creating a table for the company as a whole and for each functional area separately, where each table shows the capital expenditure for each project for each year.) • The model should find the sum of capital expenditures for all approved projects, by year, for each functional area. Recognizing that the NPVS in the table are probably optimistic estimates, the model should include another input, the possible percentage decrease in each original NPV. Then, there should be a new NPV column that reflects this percentage decrease. • The model should list the ROI (return on investment) for each project, defined as the NPV as a percentage of the total capital expenditure for the project. Each ROI should be based on the adjusted NPV from the previous bullet. (Note: The ROI for any project is the same, regardless of whether Ewing undertakes it at the 100% level or in a partnership.) • The model should include a one-way data table in which the column input is the common percentage decrease in each NPV mentioned previously, varied from 0% to 30% in increments of 5%. The outputs in the data table should include the following statistics for the ROIS of undertaken projects: the average; the minimum: and the maximum. Of course, the results in this data table should update automatically if the 0/1 values in the second bullet are changed. (Note: Excel has an AVERAGEIF function you can use to find the requested average, but it does not have corresponding MINIF or MAXIF functions. Finding formulas for the requested minimum and maximum is more difficult than it sounds, so you can consider this part a bonus, and you can omit it if necessary.) The model should be accompanied by a line chart of total capital expenditures for all approved projects by year and a separate such line chart for each functional area. I Ewing Natural Gas is a large energy company with headquarters in Dallas, Texas. The company offers a wide variety of energy products and has annual revenues of approximately $50 billion. Because of the diverse nature of the company, its Manager for Project Development. Cliff Erland, is under continual pressure to manage project proposals from the functional areas of the company. At any point in time, there might be dozens of projects at various stages requiring a wide variety of capital expenditures, promising widely varying future revenue streams, and containing varying degrees of risk. Cliff has a difficult balancing act. The company's CEO. J.R. Bayer, is very concerned about keeping capital expenditures within a fixed budget and managing risk. The heads of the company's functional areas are less worried about budgets and risks; they are most concerned that their pet projects are approved. Cliff also knows that many of the proposed projects, especially those requiring large capital expenditures, must be led by senior project managers with the appropriate experience and skills, and he is keenly aware that the company has only a limited supply of such managers. Cliff is currently about to meet with all parties involved to discuss project proposals for the next three years. He has proposals from the various functional areas for projects they would like to undertake. Each of these is accompanied by a schedule of capital expenditures over the next three years and a financial analysis of the expected revenue streams. These lead to an NPV for each proposal, using the company's discount rate of 12%. (See Table 2.2.) J.R. Bayer has stated in no uncertain terms that the total of capital expenditures for the approved projects can be no more than $10 billion and that no more than $4 billion should be spent in any single year. Unfortunately, the capital expenditures for the potential list of projects is well over $ 10 billion, so Cliff knows that some of these very promising projects will not be approved. Before the big meeting. Cliff wants to be thoroughly prepared to answer all of the questions he knows he will be asked by the CEO, the functional heads, and other interested parties. As a first step, he wants you to develop an Excel spreadsheet model that provides the following. (You will be asked to extend this analysis in cases in later chapters.) • The model should list the given financial information for all potential projects. • The model should associate with each proposed project a cell that is I if the project is approved and 0 if it is not approved. Table 2.2 Financial Estimates for Potential Projects (in $ millions) Project Index Functional Area (FA) Partnership Percentage Capex Year 1 Capex Year 2 Capex Year 3 NPV FAI FAI FAI FAI FAI FA2 FA2 FA2 FA2 FA3 FA3 FA3 100% 33% 50% 100% 75% 50% 100% 100% 67% 100% 50% 100% 250 500 100 750 200 00 300 400 60 180 100 300 200 500 80 300 310 220 180 410 280 400 800 1000 300 300 750 750 700 300 600 800 6. 10 400 100 700 1500 600 200 500 400 400 300 400 380 100 260 340 12 • Several of the projects, if approved, must be undertaken in joint partnership with another company. For example, if project 3 is approved (see Table 2.2). Ewing will take a 50% share in the project, and the other 50% will be shared by a partner. In this case. Ewing incurs only 50% of the expenditures and receives only 50% of the revenues. • Each functional area wants as many of its projects to be approved as possible, but it certainly does not want to be shut out altogether. The model should indicate each of the following: the number of approved projects for each functional area and whether each functional area gets at least one approved project. The latter should be indicated by a 0/1 value: 0 if the functional area is shut out and 1 if it gets at least one. • The model should find the sum of capital expenditures for all approved projects, both by year and by the total over all three years. It should also address J.R. Bayer's concerns by indicating whether the total for all three years exceeds $10 billion and, for each year, whether that year's total expenditures exceed $4 billion. As in the previous bullet, these should be indicated by 0/1 values. (Hint: For this bullet and the next one, you might want to avoid complex formulas by creating a table for the company as a whole and for each functional area separately, where each table shows the capital expenditure for each project for each year.) • The model should find the sum of capital expenditures for all approved projects, by year, for each functional area. Recognizing that the NPVS in the table are probably optimistic estimates, the model should include another input, the possible percentage decrease in each original NPV. Then, there should be a new NPV column that reflects this percentage decrease. • The model should list the ROI (return on investment) for each project, defined as the NPV as a percentage of the total capital expenditure for the project. Each ROI should be based on the adjusted NPV from the previous bullet. (Note: The ROI for any project is the same, regardless of whether Ewing undertakes it at the 100% level or in a partnership.) • The model should include a one-way data table in which the column input is the common percentage decrease in each NPV mentioned previously, varied from 0% to 30% in increments of 5%. The outputs in the data table should include the following statistics for the ROIS of undertaken projects: the average; the minimum: and the maximum. Of course, the results in this data table should update automatically if the 0/1 values in the second bullet are changed. (Note: Excel has an AVERAGEIF function you can use to find the requested average, but it does not have corresponding MINIF or MAXIF functions. Finding formulas for the requested minimum and maximum is more difficult than it sounds, so you can consider this part a bonus, and you can omit it if necessary.) The model should be accompanied by a line chart of total capital expenditures for all approved projects by year and a separate such line chart for each functional area. I Ewing Natural Gas is a large energy company with headquarters in Dallas, Texas. The company offers a wide variety of energy products and has annual revenues of approximately $50 billion. Because of the diverse nature of the company, its Manager for Project Development. Cliff Erland, is under continual pressure to manage project proposals from the functional areas of the company. At any point in time, there might be dozens of projects at various stages requiring a wide variety of capital expenditures, promising widely varying future revenue streams, and containing varying degrees of risk. Cliff has a difficult balancing act. The company's CEO. J.R. Bayer, is very concerned about keeping capital expenditures within a fixed budget and managing risk. The heads of the company's functional areas are less worried about budgets and risks; they are most concerned that their pet projects are approved. Cliff also knows that many of the proposed projects, especially those requiring large capital expenditures, must be led by senior project managers with the appropriate experience and skills, and he is keenly aware that the company has only a limited supply of such managers. Cliff is currently about to meet with all parties involved to discuss project proposals for the next three years. He has proposals from the various functional areas for projects they would like to undertake. Each of these is accompanied by a schedule of capital expenditures over the next three years and a financial analysis of the expected revenue streams. These lead to an NPV for each proposal, using the company's discount rate of 12%. (See Table 2.2.) J.R. Bayer has stated in no uncertain terms that the total of capital expenditures for the approved projects can be no more than $10 billion and that no more than $4 billion should be spent in any single year. Unfortunately, the capital expenditures for the potential list of projects is well over $ 10 billion, so Cliff knows that some of these very promising projects will not be approved. Before the big meeting. Cliff wants to be thoroughly prepared to answer all of the questions he knows he will be asked by the CEO, the functional heads, and other interested parties. As a first step, he wants you to develop an Excel spreadsheet model that provides the following. (You will be asked to extend this analysis in cases in later chapters.) • The model should list the given financial information for all potential projects. • The model should associate with each proposed project a cell that is I if the project is approved and 0 if it is not approved. Table 2.2 Financial Estimates for Potential Projects (in $ millions) Project Index Functional Area (FA) Partnership Percentage Capex Year 1 Capex Year 2 Capex Year 3 NPV FAI FAI FAI FAI FAI FA2 FA2 FA2 FA2 FA3 FA3 FA3 100% 33% 50% 100% 75% 50% 100% 100% 67% 100% 50% 100% 250 500 100 750 200 00 300 400 60 180 100 300 200 500 80 300 310 220 180 410 280 400 800 1000 300 300 750 750 700 300 600 800 6. 10 400 100 700 1500 600 200 500 400 400 300 400 380 100 260 340 12 • Several of the projects, if approved, must be undertaken in joint partnership with another company. For example, if project 3 is approved (see Table 2.2). Ewing will take a 50% share in the project, and the other 50% will be shared by a partner. In this case. Ewing incurs only 50% of the expenditures and receives only 50% of the revenues. • Each functional area wants as many of its projects to be approved as possible, but it certainly does not want to be shut out altogether. The model should indicate each of the following: the number of approved projects for each functional area and whether each functional area gets at least one approved project. The latter should be indicated by a 0/1 value: 0 if the functional area is shut out and 1 if it gets at least one. • The model should find the sum of capital expenditures for all approved projects, both by year and by the total over all three years. It should also address J.R. Bayer's concerns by indicating whether the total for all three years exceeds $10 billion and, for each year, whether that year's total expenditures exceed $4 billion. As in the previous bullet, these should be indicated by 0/1 values. (Hint: For this bullet and the next one, you might want to avoid complex formulas by creating a table for the company as a whole and for each functional area separately, where each table shows the capital expenditure for each project for each year.) • The model should find the sum of capital expenditures for all approved projects, by year, for each functional area. Recognizing that the NPVS in the table are probably optimistic estimates, the model should include another input, the possible percentage decrease in each original NPV. Then, there should be a new NPV column that reflects this percentage decrease. • The model should list the ROI (return on investment) for each project, defined as the NPV as a percentage of the total capital expenditure for the project. Each ROI should be based on the adjusted NPV from the previous bullet. (Note: The ROI for any project is the same, regardless of whether Ewing undertakes it at the 100% level or in a partnership.) • The model should include a one-way data table in which the column input is the common percentage decrease in each NPV mentioned previously, varied from 0% to 30% in increments of 5%. The outputs in the data table should include the following statistics for the ROIS of undertaken projects: the average; the minimum: and the maximum. Of course, the results in this data table should update automatically if the 0/1 values in the second bullet are changed. (Note: Excel has an AVERAGEIF function you can use to find the requested average, but it does not have corresponding MINIF or MAXIF functions. Finding formulas for the requested minimum and maximum is more difficult than it sounds, so you can consider this part a bonus, and you can omit it if necessary.) The model should be accompanied by a line chart of total capital expenditures for all approved projects by year and a separate such line chart for each functional area. I
Expert Answer:
Answer rating: 100% (QA)
1 Deterministic case We Linear programming approach Dec... View the full answer

Related Book For 

College Mathematics for Business Economics Life Sciences and Social Sciences
ISBN: 978-0321614001
12th edition
Authors: Raymond A. Barnett, Michael R. Ziegler, Karl E. Byleen
Posted Date:
Students also viewed these accounting questions
-
Ewing Natural Gas is a large energy company with headquarters in Dallas, Texas. The company offers a wide variety of energy products and has annual revenues of approximately $50 billion. Because of...
-
A large energy company produces electricity, natural gas, and oil. The production of a dollar's worth of electricity requires inputs of $0.30 from electricity, $0.10 from natural gas, and $0.20 from...
-
Johnson & Johnson is a health-care company with headquarters in New Brunswick, New Jersey. Its revenues in the fiscal year ended January 1, 2012, were more than $65 billion. Following are items from...
-
You are the manager of a fast food restaurant. Part of your job is to report to the boss at the end of the day which special is selling best. Use your vast knowledge of descriptive statistics and...
-
When two closely related species are crossed, the progeny will tend to have physical traits that lie somewhere between those of the two parents. Whether a similar mixing occurs with behavioral traits...
-
Stan purchases machinery costing $100,000 for use in his business in 2011. The machinery is 7-year MACRS property and has an ADS life of 12 years. Prepare a depreciation schedule using the regular...
-
What is the purpose of practice aids in forensic and valuation services?
-
Based on Crow Manufacturings data in Exercise 2420, assume that a transfer price of $110 has been established and that 40,000 units of materials are transferred, with no reduction in the Materials...
-
Given that f(x) = x2 -6 and g(x)=-7x + 5, find d() () if it exists.
-
Amy Lloyd is interested in leasing a new Honda and has contacted three automobile dealers for pricing information. Each dealer offered Amy a closed-end 36-month lease with no down payment due at the...
-
Calculate the equilibrium constant for each of the reactions at25 ?C. Standard Electrode Potentials at 25 ?C Reduction Half-Reaction E ?(V) Pb2+( a q )+2 e ? ?Pb( s ) -0.13 Mg2+( a q )+2 e ? ?Mg( s )...
-
(c) Consider a competitive producer with a production function of l 0.4 k 0.1 , labor price of w and capital price of 1(not v, the number one), and an output price of p. Suppose capital in the...
-
The What Works in Schools textbook, Marzano reports that there are 11 factors that affect student achievement. Of the 11 factors, which of them are completely out of the teacher's control? Since they...
-
As a seasoned lending officer with Royal Bank, you are very familiar with the federal regulations related to the stress test requirement when dealing with mortgage requests from your customers. You...
-
Summarize the threats and challenges you have identified within the current strategic plan. Determine how to execute the strategic initiatives in order to address the threats and challenges. Explain...
-
Herzberg referred to demotivators in the workplace as hygiene factors. Hygiene factors are conditions that, if present, do not motivate, but if absent, can be significant demotivators. Relying on...
-
The total cost of a group of items at a grocery store is based on the sum of the individual product prices and the tax (which is 5.75%). Products that are considered "necessities" are not taxed,...
-
Show that, given a maximum flow in a network with m edges, a minimum cut of N can be computed in O(m) time.
-
In Problems 21-26, use a definite integral to find the area bounded by the graphs of the indicated equations over the given interval. Then check your answer by finding the area without using a...
-
Interpret the results of Problem 44 with both a graph and a description of the graph.
-
In Problems 37-52, find the area bounded by the graphs of the indicated equations over the given intervals (when stated). Compute answers to three decimal places. y = -x + 1; y = 0; -1 x 2
-
Within the context of Exercise 1, let \(\|X\|_{r}\) be defined for \(X \in X_{r}\) as \[\|X\|_{r}=\left[\int_{\Omega}|X(\omega)|^{r} d P(\omega)ight]^{1 / r}\] Prove that \(\|X\|_{r}\) is a norm....
-
Let \(\left\{X_{n}ight\}_{n=1}^{\infty}\) be a sequence of random variables where \(X_{n}\) has distribution \(F_{n}\) which has mean \(\theta_{n}\) for all \(n \in \mathbb{N}\). Suppose that \[\lim...
-
Let \(\left\{X_{n}ight\}_{n=1}^{\infty}\) be a sequence of independent random variables where \(X_{n}\) has a Triangular \(\left(\alpha_{n}, \beta_{n}, \gamma_{n}ight)\) distribution for all \(n \in...

Study smarter with the SolutionInn App