

Be clear about the problem or goal being investigated and the variables that need to be examined.
Question:
Be clear about the problem or goal being investigated and the variables that need to be examined.
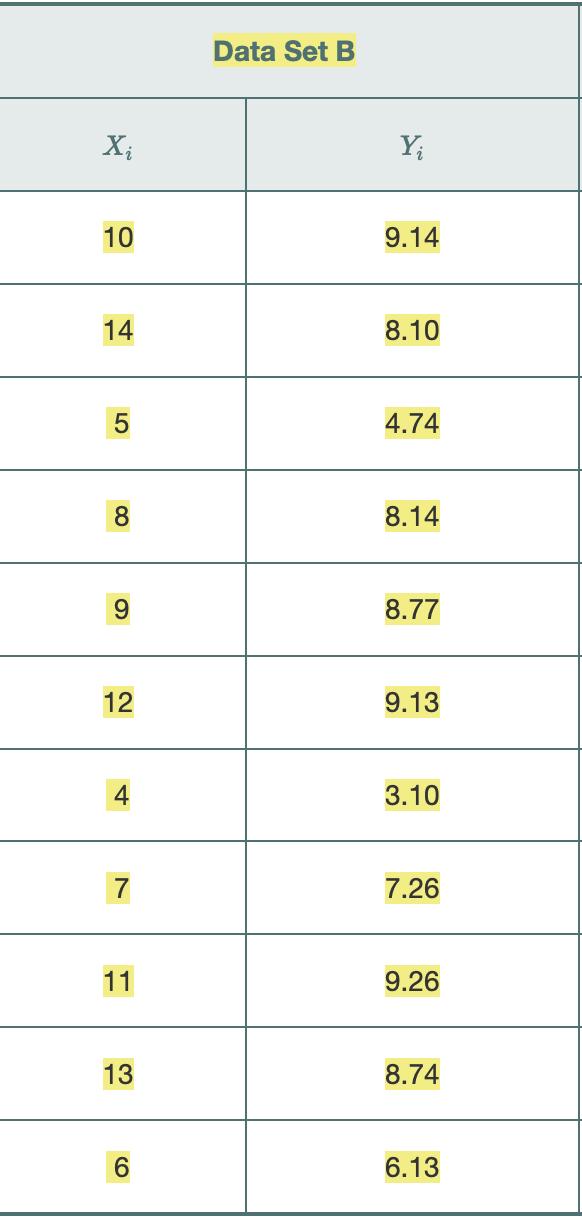
Construct a scatter plot to observe the possible relationship between X and Y.
Perform a residual analysis to check the assumptions of regression (linearity, independence, normality, equal variance):
Plot the residuals versus the independent variable to determine whether the linear model is appropriate and to check for equal variance.
Construct a histogram, stem-and-leaf display, boxplot, or normal probability plot of the residuals to check for normality.
Plot the residuals versus time to check for independence. (This step is necessary only if the data are collected over time.)
If there are violations of the assumptions, use alternative methods to least-squares regression or alternative least-squares models (see reference 4 and Section 15.2).
If there are no violations of the assumptions, carry out tests for the significance of the regression coefficients and develop confidence and prediction intervals.
Refrain from making predictions and forecasts outside the relevant range of the independent variable.
Remember that the relationships identified in observational studies may or may not be due to cause-and-effect relationships. (While causation implies correlation, correlation does not imply causation.
)
Expert Answer:


Statistics for Business and Economics
ISBN: 978-0321826237
12th edition
Authors: James T. McClave, P. George Benson, Terry T Sincich
