

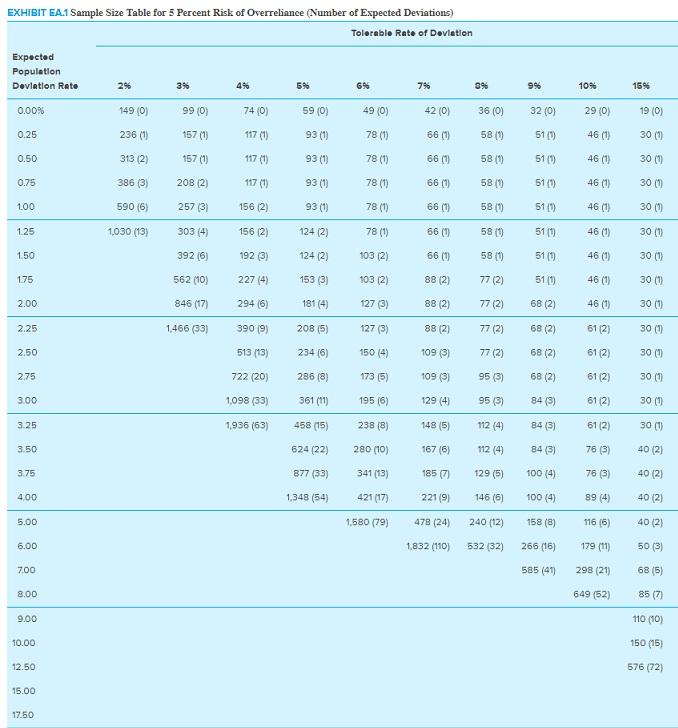
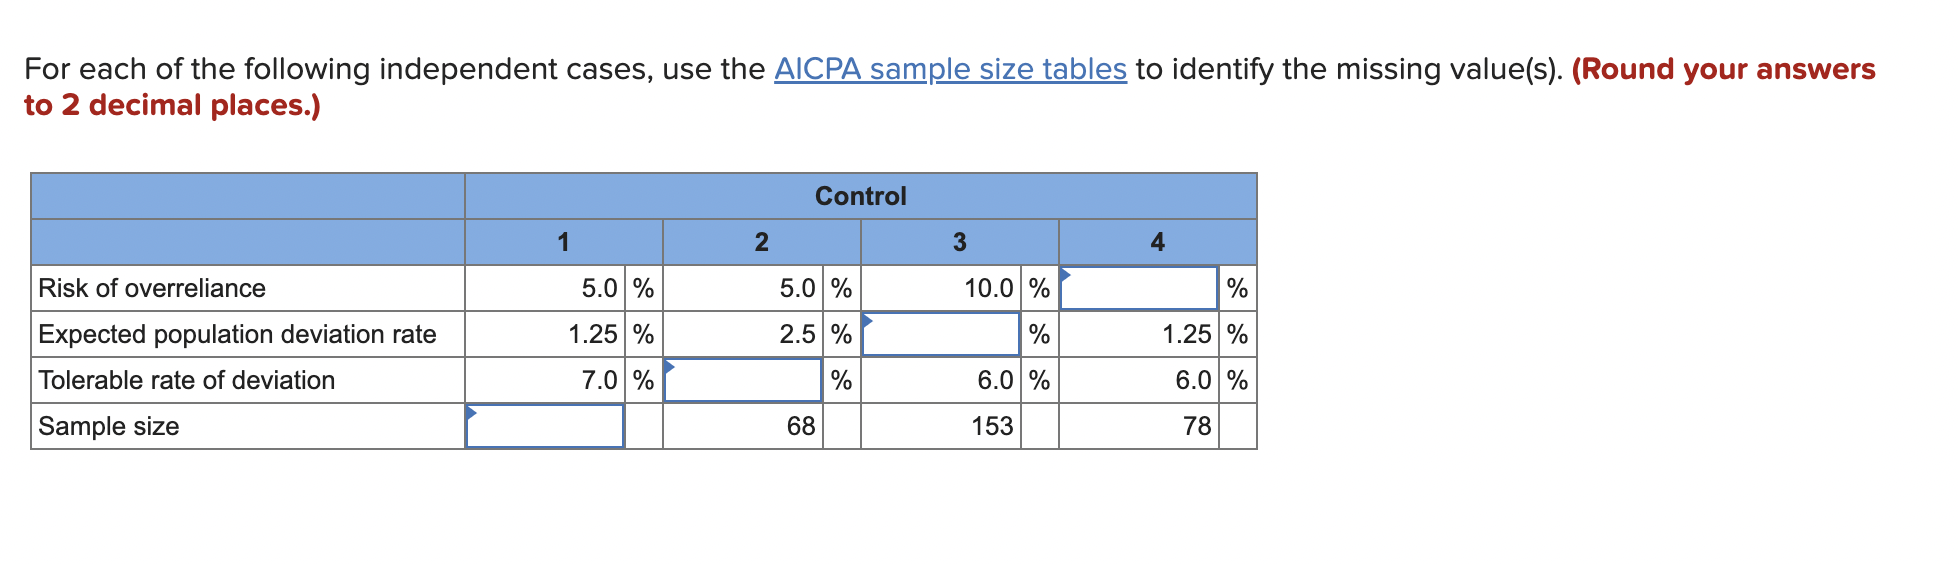
EXHIBIT EA.1 Sample Size Table for 5 Percent Risk of Overreliance (Number of Expected Deviations) Tolerable...
Fantastic news! We've Found the answer you've been seeking!
Question:
Expert Answer:

Related Book For 
Auditing and Assurance Services
ISBN: 978-0077862343
6th edition
Authors: Timothy Louwers, Robert Ramsay, David Sinason, Jerry Straws
Posted Date:
