

BUSINESS CASE TOYOTA Ca Maler If you or someone you know bought a new car recently,...
Fantastic news! We've Found the answer you've been seeking!
Question:
Transcribed Image Text:
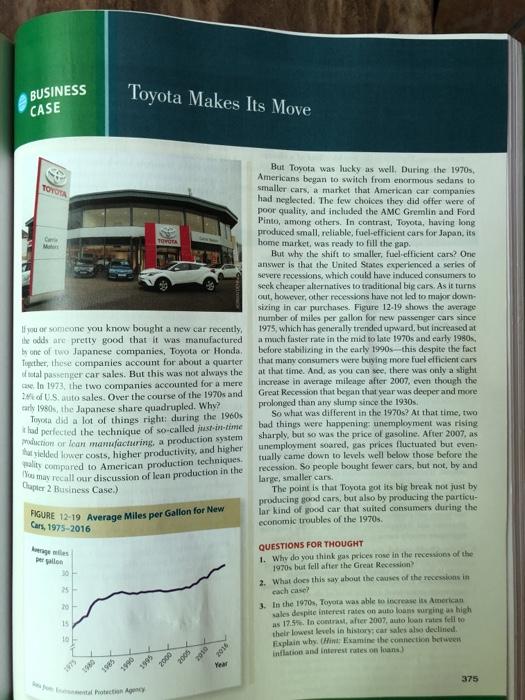
BUSINESS CASE TOYOTA Ca Maler If you or someone you know bought a new car recently, the odds are pretty good that it was manufactured by one of two Japanese companies, Toyota or Honda, Together, these companies account for about a quarter of total passenger car sales. But this was not always the case In 1973, the two companies accounted for a mere 1 of U.S. auto sales. Over the course of the 1970s and early 1980s, the Japanese share quadrupled. Why? Toyota did a lot of things right: during the 1960s had perfected the technique of so-called just-in-time production or lean manufacturing, a production system that yielded lower costs, higher productivity, and higher ality compared to American production techniques. You may recall our discussion of lean production in the Chapter 2 Business Case.) Average les per gallon FIGURE 12-19 Average Miles per Gallon for New Cars, 1975-2016 30 25 20 15 10 1975 Toyota Makes Its Move 1980 1985 TOYOTA 1990 ental Protection Agency 1995 2000 2005 2910 2016 Year But Toyota was lucky as well. During the 1970s, Americans began to switch from enormous sedans to smaller cars, a market that American car companies had neglected. The few choices they did offer were of poor quality, and included the AMC Gremlin and Ford Pinto, among others. In contrast, Toyota, having long produced small, reliable, fuel-efficient cars for Japan, its home market, was ready to fill the gap. But why the shift to smaller, fuel-efficient cars? One answer is that the United States experienced a series of severe recessions, which could have induced consumers to seek cheaper alternatives to traditional big cars. As it turns out, however, other recessions have not led to major down- sizing in car purchases. Figure 12-19 shows the average number of miles per gallon for new passenger cars since 1975, which has generally trended upward, but increased at a much faster rate in the mid to late 1970s and early 1980s, before stabilizing in the early 1990s-this despite the fact t that many consumers were buying more fuel efficient cars at that time. And, as you can see, there was only a slight increase in average mileage after 2007, even though the Great Recession that began that year was deeper and more prolonged than any slump since the 1930s. So what was different in the 1970s? At that time, two bad things were happening: unemployment was rising sharply, but so was the price of gasoline. After 2007, as unemployment soared, gas prices fluctuated but even- tually came down to levels well below those before the recession. So people bought fewer cars, but not, by and large, smaller cars. The point is that Toyota got its big break not just by producing good cars, but also by producing the particu- lar kind of good car that suited consumers during the economic troubles of the 1970s. QUESTIONS FOR THOUGHT 1. Why do you think gas prices rose in the recessions of the 1970s but fell after the Great Recession) 2. What does this say about the causes of the recessions in each case? 3. In the 1970s, Toyota was able to increase its American sales despite interest rates on auto loans surging as high as 17.5%. In contrast, after 2007, auto loan rates fell to their lowest levels in history; car sales also declined. Explain why. (Hint: Examine the connection between inflation and interest rates on loans) 375 BUSINESS CASE TOYOTA Ca Maler If you or someone you know bought a new car recently, the odds are pretty good that it was manufactured by one of two Japanese companies, Toyota or Honda, Together, these companies account for about a quarter of total passenger car sales. But this was not always the case In 1973, the two companies accounted for a mere 1 of U.S. auto sales. Over the course of the 1970s and early 1980s, the Japanese share quadrupled. Why? Toyota did a lot of things right: during the 1960s had perfected the technique of so-called just-in-time production or lean manufacturing, a production system that yielded lower costs, higher productivity, and higher ality compared to American production techniques. You may recall our discussion of lean production in the Chapter 2 Business Case.) Average les per gallon FIGURE 12-19 Average Miles per Gallon for New Cars, 1975-2016 30 25 20 15 10 1975 Toyota Makes Its Move 1980 1985 TOYOTA 1990 ental Protection Agency 1995 2000 2005 2910 2016 Year But Toyota was lucky as well. During the 1970s, Americans began to switch from enormous sedans to smaller cars, a market that American car companies had neglected. The few choices they did offer were of poor quality, and included the AMC Gremlin and Ford Pinto, among others. In contrast, Toyota, having long produced small, reliable, fuel-efficient cars for Japan, its home market, was ready to fill the gap. But why the shift to smaller, fuel-efficient cars? One answer is that the United States experienced a series of severe recessions, which could have induced consumers to seek cheaper alternatives to traditional big cars. As it turns out, however, other recessions have not led to major down- sizing in car purchases. Figure 12-19 shows the average number of miles per gallon for new passenger cars since 1975, which has generally trended upward, but increased at a much faster rate in the mid to late 1970s and early 1980s, before stabilizing in the early 1990s-this despite the fact t that many consumers were buying more fuel efficient cars at that time. And, as you can see, there was only a slight increase in average mileage after 2007, even though the Great Recession that began that year was deeper and more prolonged than any slump since the 1930s. So what was different in the 1970s? At that time, two bad things were happening: unemployment was rising sharply, but so was the price of gasoline. After 2007, as unemployment soared, gas prices fluctuated but even- tually came down to levels well below those before the recession. So people bought fewer cars, but not, by and large, smaller cars. The point is that Toyota got its big break not just by producing good cars, but also by producing the particu- lar kind of good car that suited consumers during the economic troubles of the 1970s. QUESTIONS FOR THOUGHT 1. Why do you think gas prices rose in the recessions of the 1970s but fell after the Great Recession) 2. What does this say about the causes of the recessions in each case? 3. In the 1970s, Toyota was able to increase its American sales despite interest rates on auto loans surging as high as 17.5%. In contrast, after 2007, auto loan rates fell to their lowest levels in history; car sales also declined. Explain why. (Hint: Examine the connection between inflation and interest rates on loans) 375
Expert Answer:
Answer rating: 100% (QA)
Why do you think gas prices rose in the recessions of the 1970s but fell after the Great Recession Do you think the market for small cars will rebound ... View the full answer

Related Book For 

Posted Date:
Students also viewed these management leadership questions
-
Explain why automobile manufacturers produce their own engines but purchase mirrors from independent suppliers.
-
The price of gasoline has increased during the past year. a. Explain why the law of demand applies to gasoline just as it does to all other goods and services. b. Explain how the substitution effect...
-
Was it ethical during the 1990s for automobile manufacturers to attempt to accommodate an ever-increasing consumer appetite for SUVs with their low fuel efficiency? Was it good business?
-
The statements of financial position of Parkway plc for 20X7 and 20X8 are given below, together with the income statement for the year ended 30 June 20X8. Statement of comprehensive income of Parkway...
-
Create the following matrix E: (a) Create a 2 3 matrix F from the second and third rows, and the third through the fifth columns of matrix E. (b) Create a 4 4 matrix G from all rows and the third...
-
Your firm has an average receipt size of $145. A bank has approached you concerning a lockbox service that will decrease your total collection time by two days. You typically receive 5,600 checks per...
-
Law of corresponding state was proposed and formulated by (a) R.S. Pitzer (b) Gibbs-Duhem (c) van der Waals (d) Charles Dickens.
-
Dogs-R-Us and K-9, Inc. are two retail stores that cater to the needs of dog owners in the greater Charleston area. There is healthy competition between these two establishments. Both operate 52...
-
List and describe the phases of the Labor Relations process.? Who are the participants in the labor relations process?
-
Compute the surface area of revolution about the x-axis over the interval. y=x-lnx, [1, e]
-
Which of the following is not a valid elementary row operation to perform on an augmented matrix using the Gauss Elimination method? Interchange/reorder rows Multiply or divide a multiple of one row...
-
How can liquidity ratios, such as the current ratio and quick ratio, help assess a company's short-term financial health?
-
How can ratio analysis be integrated into a broader financial analysis, including cash flow analysis and trend analysis?
-
What do leverage ratios like the debt-to-equity ratio reveal about a company's financial risk and capital structure?
-
A special investment project will require 5 years of planning and implementation, but will allow your firm to receive $350,000 at the end of years 6, 7, 8,9, and 10. If the appropriate discount rate...
-
Calculate the total interest on a mortgage paid monthly : Amount of loan = 225,024 Annual interest rate = 8% Length of loan = 20 years Round your answer to the nearest hundredth. Enter your answer as...
-
Consider the following two machines a company can purchase. The following table provides the costs of the machines and the annual cash flows obtained from the machines over their lifetimes. Initial...
-
The graph of an equation is given. (a) Find the intercepts. (b) Indicate whether the graph is symmetric with respect to the x-axis, the y-axis, or the origin. -3 6 -6 3 x
-
On a graph mark the market equilibrium and show the efficient quantity of water taken. A natural spring runs under land owned by ten people. Each person has the right to sink a well and can take...
-
a. How does Wandas demand for labor change? b. What happens to the number of students that Wanda employs? The market price of fish falls to 33.33 a pound, but the packers wage rate remains at $7.50...
-
Find the Nash equilibrium of the game that Bud and Wise play.
-
Have you experienced artistic portrayals of your own culture or identity that you find offensive? If so, do you think they should be censored? The statue of President Theodore Roosevelt flanked by an...
-
Describe some of the reasons that people make art and give examples of symbolism and ritual in art.
-
What is the core approach to an anthropology of art?

Study smarter with the SolutionInn App