

Fashion Bling operates a chain of 10 retail department stores. Each department store makes its own...
Fantastic news! We've Found the answer you've been seeking!
Question:
Transcribed Image Text:
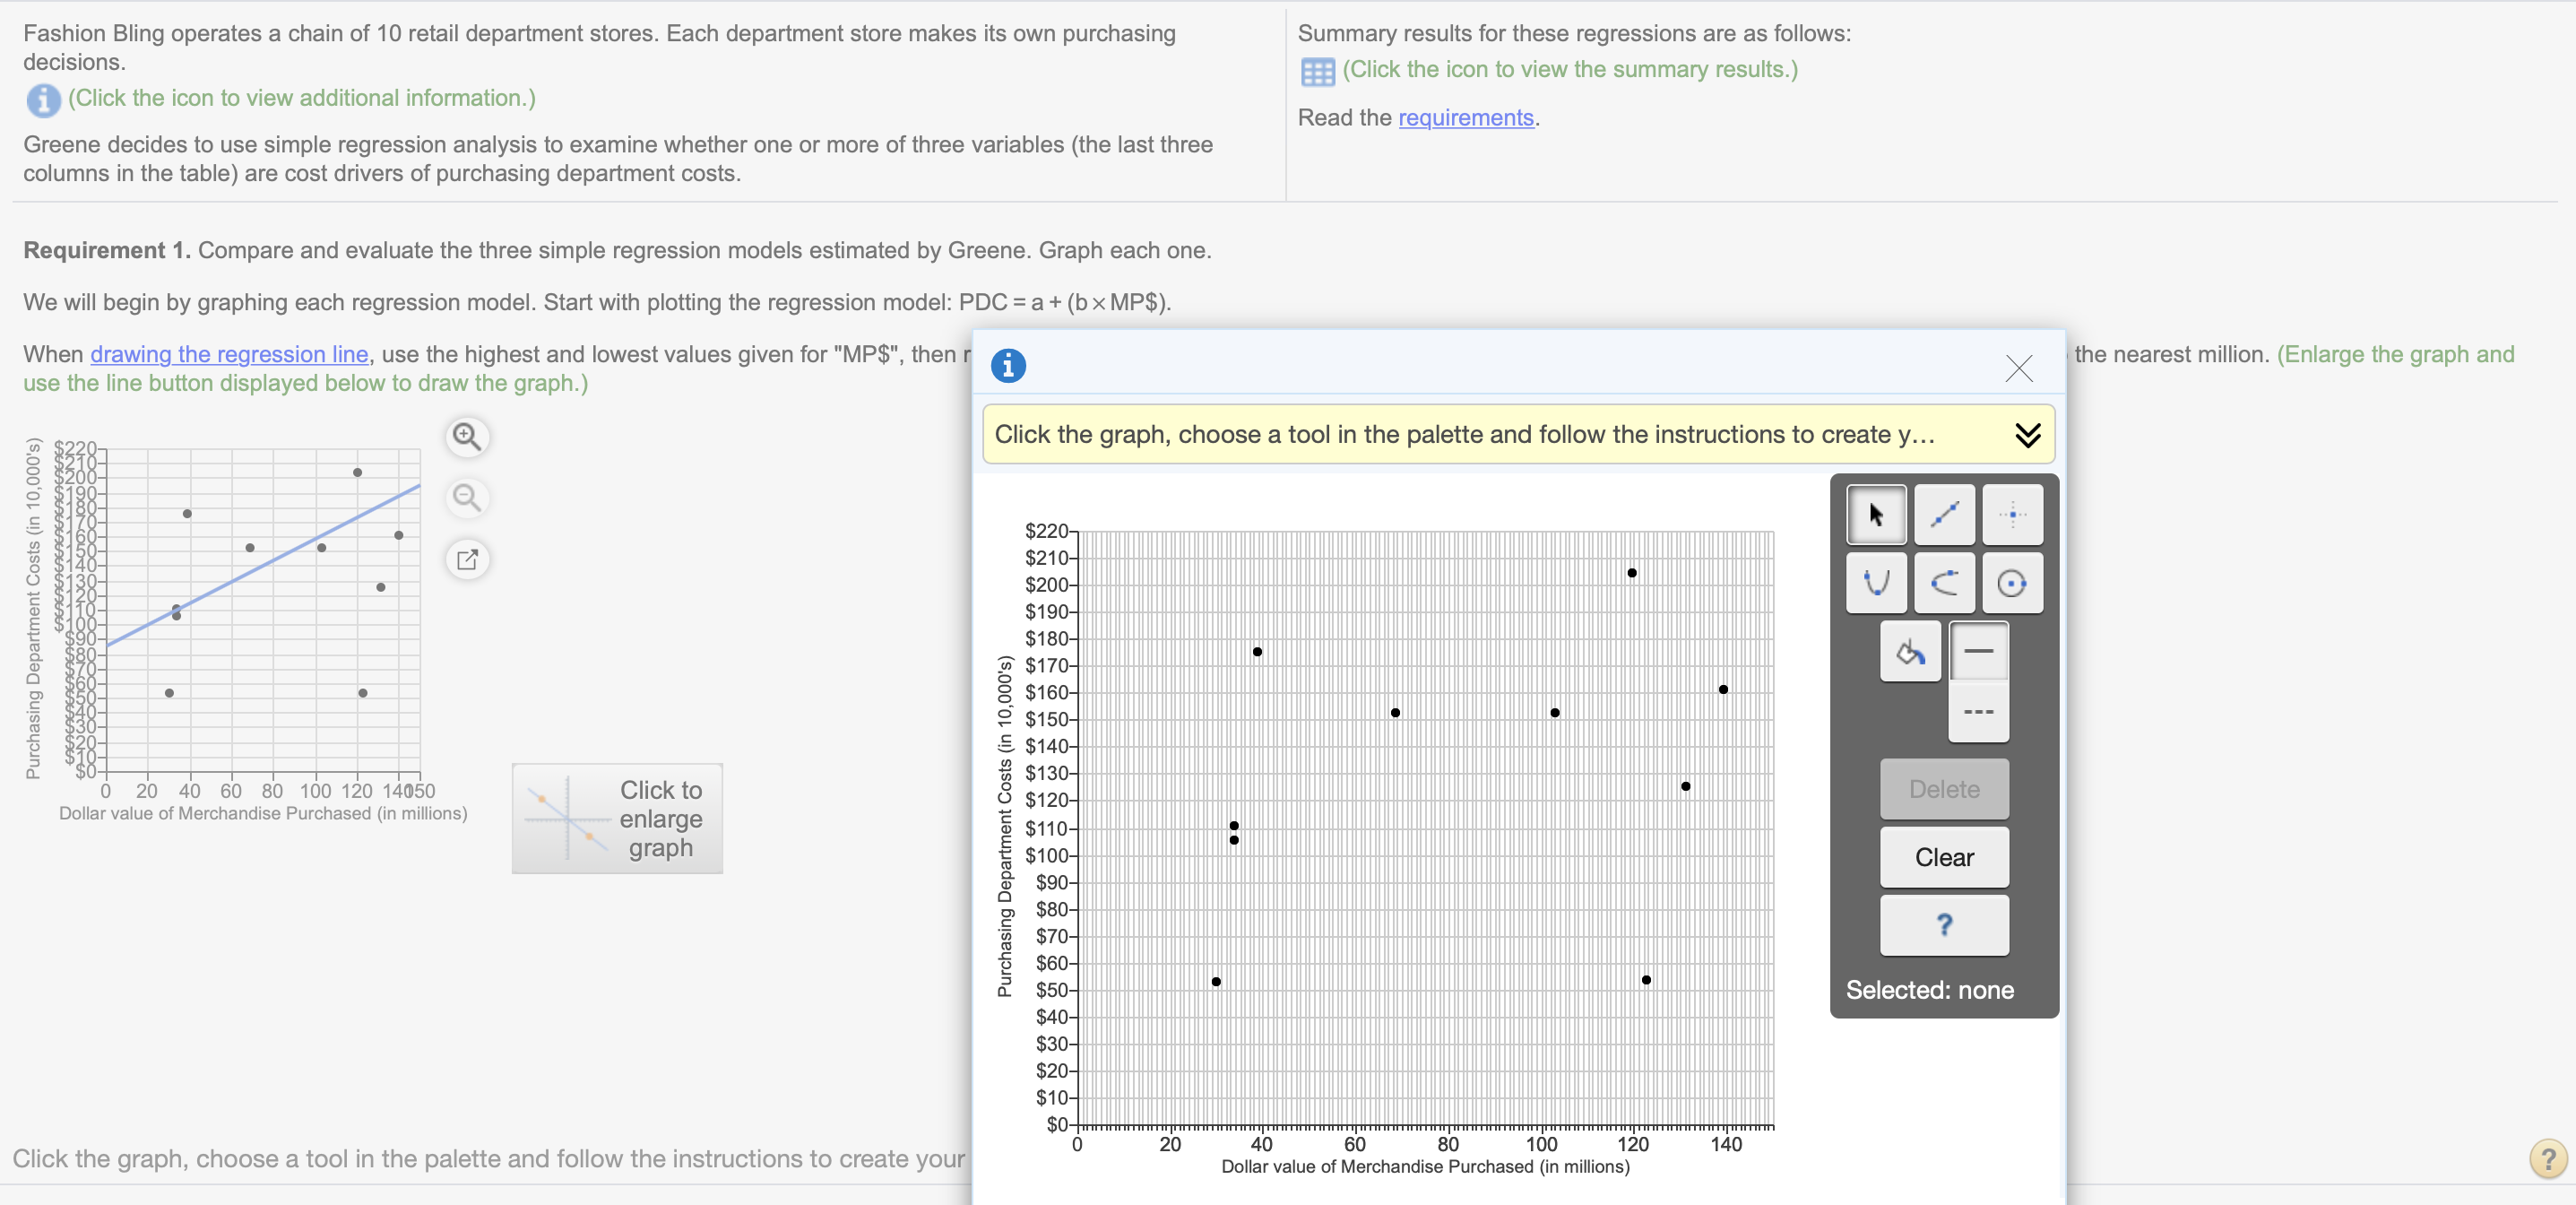
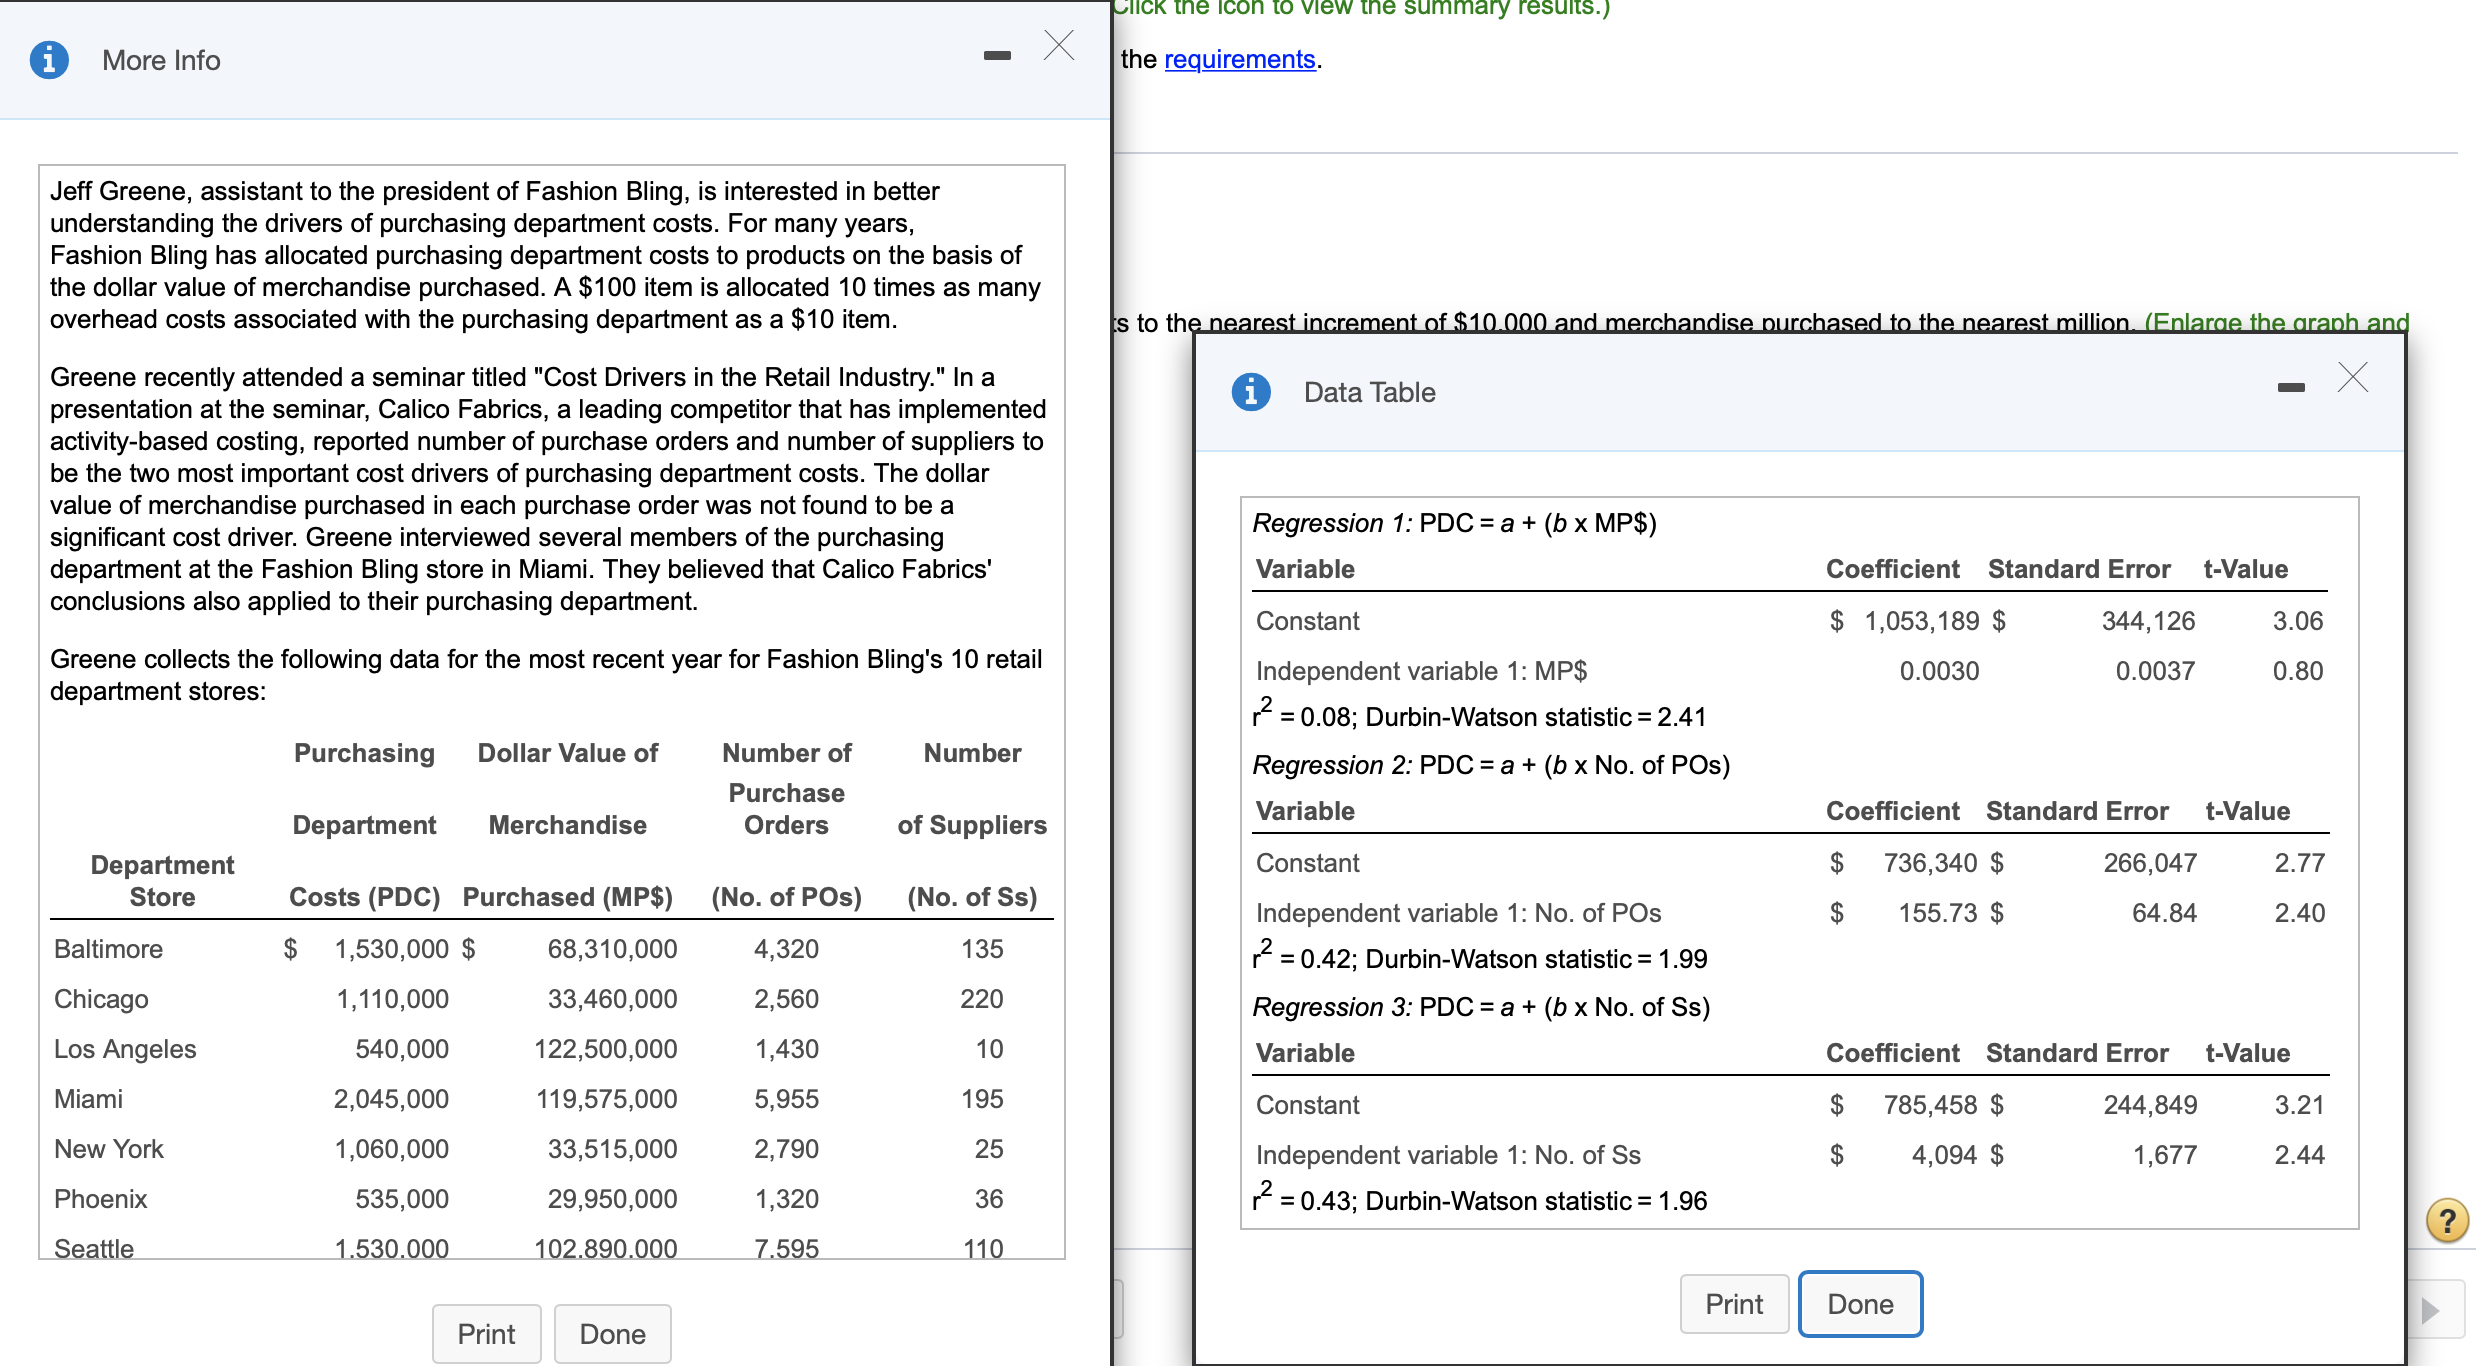
Fashion Bling operates a chain of 10 retail department stores. Each department store makes its own purchasing decisions. (Click the icon to view additional information.) Greene decides to use simple regression analysis to examine whether one or more of three variables (the last three columns in the table) are cost drivers of purchasing department costs. Requirement 1. Compare and evaluate the three simple regression models estimated by Greene. Graph each one. We will begin by graphing each regression model. Start with plotting the regression model: PDC = a + (bx MP$). When drawing the regression line, use the highest and lowest values given for "MP$", then r use the line button displayed below to draw the graph.) 1 Summary results for these regressions are as follows: (Click the icon to view the summary results.) Read the requirements. Click the graph, choose a tool in the palette and follow the instructions to create y... Purchasing Department Costs (in 10,000's) . $220- . $210- . . $200- $190 $180- . 0 20 40 60 80 100 120 14050 Dollar value of Merchandise Purchased (in millions) Click to enlarge graph Purchasing Department Costs (in 10,000's) $170- $160- $150- $140- $130- $120 $110 $100- $90- $80- $70- $60- $50- $40- $30- $20- $10- $0- 0 Click the graph, choose a tool in the palette and follow the instructions to create your =20 40 60 100 Dollar value of Merchandise Purchased (in millions) 80 120 140 8 U the nearest million. (Enlarge the graph and Delete Clear ? Selected: none More Info Click the icon to view the summary results.) the requirements. Jeff Greene, assistant to the president of Fashion Bling, is interested in better understanding the drivers of purchasing department costs. For many years, Fashion Bling has allocated purchasing department costs to products on the basis of the dollar value of merchandise purchased. A $100 item is allocated 10 times as many overhead costs associated with the purchasing department as a $10 item. Greene recently attended a seminar titled "Cost Drivers in the Retail Industry." In a presentation at the seminar, Calico Fabrics, a leading competitor that has implemented activity-based costing, reported number of purchase orders and number of suppliers to be the two most important cost drivers of purchasing department costs. The dollar value of merchandise purchased in each purchase order was not found to be a significant cost driver. Greene interviewed several members of the purchasing department at the Fashion Bling store in Miami. They believed that Calico Fabrics' conclusions also applied to their purchasing department. Greene collects the following data for the most recent year for Fashion Bling's 10 retail department stores: ts to the nearest increment of $10.000 and merchandise purchased to the nearest million. (Enlarge the graph and Data Table Regression 1: PDC = a + (b x MP$) Variable Constant Coefficient Standard Error t-Value $ 1,053,189 $ Independent variable 1: MP$ 0.0030 344,126 0.0037 3.06 0.80 r = 0.08; Durbin-Watson statistic = 2.41 Regression 2: PDC = a + (b x No. of POs) Variable Purchasing Dollar Value of Department Merchandise Number of Purchase Orders Number of Suppliers Baltimore Department Store $ 1,530,000 $ Constant $ Costs (PDC) Purchased (MP$) (No. of POs) (No. of Ss) Independent variable 1: No. of POS $ 736,340 $ 155.73 $ Coefficient Standard Error t-Value 266,047 64.84 2.77 2.40 68,310,000 4,320 135 r = 0.42; Durbin-Watson statistic = 1.99 Chicago 1,110,000 33,460,000 2,560 220 Regression 3: PDC = a + (b x No. of Ss) Los Angeles 540,000 122,500,000 1,430 10 Variable Coefficient Standard Error t-Value Miami 2,045,000 119,575,000 5,955 195 Constant $ 785,458 $ 244,849 3.21 New York 1,060,000 33,515,000 2,790 25 Independent variable 1: No. of Ss $ 4,094 $ 1,677 2.44 Phoenix 535,000 29,950,000 1,320 36 r = = 0.43; Durbin-Watson statistic = 1.96 ? Seattle 1.530.000 102.890.000 7.595 110 Print Done Print Done Fashion Bling operates a chain of 10 retail department stores. Each department store makes its own purchasing decisions. (Click the icon to view additional information.) Greene decides to use simple regression analysis to examine whether one or more of three variables (the last three columns in the table) are cost drivers of purchasing department costs. Requirement 1. Compare and evaluate the three simple regression models estimated by Greene. Graph each one. We will begin by graphing each regression model. Start with plotting the regression model: PDC = a + (bx MP$). When drawing the regression line, use the highest and lowest values given for "MP$", then r use the line button displayed below to draw the graph.) 1 Summary results for these regressions are as follows: (Click the icon to view the summary results.) Read the requirements. Click the graph, choose a tool in the palette and follow the instructions to create y... Purchasing Department Costs (in 10,000's) . $220- . $210- . . $200- $190 $180- . 0 20 40 60 80 100 120 14050 Dollar value of Merchandise Purchased (in millions) Click to enlarge graph Purchasing Department Costs (in 10,000's) $170- $160- $150- $140- $130- $120 $110 $100- $90- $80- $70- $60- $50- $40- $30- $20- $10- $0- 0 Click the graph, choose a tool in the palette and follow the instructions to create your =20 40 60 100 Dollar value of Merchandise Purchased (in millions) 80 120 140 8 U the nearest million. (Enlarge the graph and Delete Clear ? Selected: none More Info Click the icon to view the summary results.) the requirements. Jeff Greene, assistant to the president of Fashion Bling, is interested in better understanding the drivers of purchasing department costs. For many years, Fashion Bling has allocated purchasing department costs to products on the basis of the dollar value of merchandise purchased. A $100 item is allocated 10 times as many overhead costs associated with the purchasing department as a $10 item. Greene recently attended a seminar titled "Cost Drivers in the Retail Industry." In a presentation at the seminar, Calico Fabrics, a leading competitor that has implemented activity-based costing, reported number of purchase orders and number of suppliers to be the two most important cost drivers of purchasing department costs. The dollar value of merchandise purchased in each purchase order was not found to be a significant cost driver. Greene interviewed several members of the purchasing department at the Fashion Bling store in Miami. They believed that Calico Fabrics' conclusions also applied to their purchasing department. Greene collects the following data for the most recent year for Fashion Bling's 10 retail department stores: ts to the nearest increment of $10.000 and merchandise purchased to the nearest million. (Enlarge the graph and Data Table Regression 1: PDC = a + (b x MP$) Variable Constant Coefficient Standard Error t-Value $ 1,053,189 $ Independent variable 1: MP$ 0.0030 344,126 0.0037 3.06 0.80 r = 0.08; Durbin-Watson statistic = 2.41 Regression 2: PDC = a + (b x No. of POs) Variable Purchasing Dollar Value of Department Merchandise Number of Purchase Orders Number of Suppliers Baltimore Department Store $ 1,530,000 $ Constant $ Costs (PDC) Purchased (MP$) (No. of POs) (No. of Ss) Independent variable 1: No. of POS $ 736,340 $ 155.73 $ Coefficient Standard Error t-Value 266,047 64.84 2.77 2.40 68,310,000 4,320 135 r = 0.42; Durbin-Watson statistic = 1.99 Chicago 1,110,000 33,460,000 2,560 220 Regression 3: PDC = a + (b x No. of Ss) Los Angeles 540,000 122,500,000 1,430 10 Variable Coefficient Standard Error t-Value Miami 2,045,000 119,575,000 5,955 195 Constant $ 785,458 $ 244,849 3.21 New York 1,060,000 33,515,000 2,790 25 Independent variable 1: No. of Ss $ 4,094 $ 1,677 2.44 Phoenix 535,000 29,950,000 1,320 36 r = = 0.43; Durbin-Watson statistic = 1.96 ? Seattle 1.530.000 102.890.000 7.595 110 Print Done Print Done
Expert Answer:

Related Book For 
Cost Accounting A Managerial Emphasis
ISBN: 978-0132109178
14th Edition
Authors: Charles T. Horngren, Srikant M.Dater, George Foster, Madhav
Posted Date:
Students also viewed these accounting questions
-
Moren Corporation Moren Corporation was building three additional generation stations to serve its rapidly expanding energy market. To link these stations with a total area grid, a new method of...
-
Perfect Fit operates a chain of 10 retail department stores. Each department store makes its own purchasing decisions. Carl Hart, assistant to the president of Perfect Fit, is interested in better...
-
Designer Wear operates a chain of 10 retail department stores. Each department store makes its own purchasing decisions. Barry Lee, assistant to the president of Designer Wear, is interested in...
-
Calculate the moment of inertia about the base of composite lamina made up of a semicircle of 120 mm base diameter is removed from base of rectangle 120 mm X 500 mm such that lamina is symmetrical to...
-
Mario had barely arrived at the office when his boss, Marilyn, swept into his office and in her usual brusque way said, "Hi, Mario. Good weekend? Hope so. I got this idea: We've been concerned about...
-
Let n be an integer. Prove that n is even if and only if 31n + 12 is even.
-
Assume you own a new, family-style restaurant that will open for business in the coming year. Formulate a long term goal for the restaurant, and then develop short-term goals to help you achieve the...
-
Suppose a chain of KFC franchises in Shanghai had budgeted sales for 2012 of RMB 7.8 million (where RMB stands for the Chinese unit of currency, officially the renminbi, also called the yuan). Cost...
-
Given the circle below with chords JK and LM. Find the length of KN. Round to the nearest tenth if necessary. 6 L 15 N 14 M K
-
Find the zeros and x-intercepts of f(x) = x48x - 9. O Zeros: 1, 3i x-intercepts: 1 O Zeros: 3i, 1 x-intercepts: +1 O Zeros: i, 3 x-intercepts: +3 O Zeors: 3, 1 x-intercepts: 3, 1
-
Your business is a preschool daycare in Ontario. and u have to collect info and compare your business with similar businesses. Part D Competitor Data Collection and Competitor Analysis Plan: Complete...
-
Ray and Wilma jointly owned a suburban house and garden. They were excited when they learned that they had won a garden makeover for their backyard which would be filmed and shown on the hugely...
-
The marketing department of Jessi Corporation has submitted the following sales forecast for the upcoming fiscal year (all sales are on account): 1st Quarter 2nd Quarter 3rd Quarter 4th Quarter...
-
A brief summary of the facts of the case. Tell me what you want (in other words, reinstatement of the grievor, substitution of a lesser penalty or upholding the decision to terminate the grievor's...
-
Henry secures a $360,000 3/1 ARM loan at an initial interest rate of 3.075%. His monthly payment is $1,532.38. After 3 years, the interest rate on Henry's loan changes to 3.75%. Calculate his new...
-
An issue of preferred stock is paying an annual dividend of $1.15. The growth rate for the firm's common stock is 6.5%. What is the preferred stock price if the required rate of return is 8.5%?
-
At 31 December 20X9, the end of the annual reporting period, the accounts of Huron Company showed the following: a. Sales revenue for 20X9, $ 2,950,000, of which one- quarter was on credit. b....
-
Wollogong Group Ltd. of New South Wales, Australia, acquired its factory building about 10 years ago. For several years the company has rented out a small annex attached to the rear of the building....
-
Listed below are a number of costs typically found in organizations. 1. Property taxes, factory. 2. Boxes used for packaging detergent produced by the company. 3. Salespersons' commissions. 4....
-
You have just been hired by Ogden Company to fill a new position that was created in response to rapid growth in sales. It is your responsibility to coordinate shipments of finished goods from the...

Study smarter with the SolutionInn App