

The graph below displays the sample sizes and percentages of people in different age and gender groups
Question:
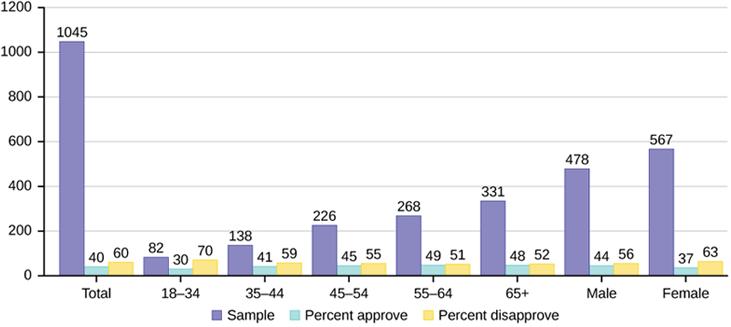
The graph below displays the sample sizes and percentages of people in different age and gender groups who were polled concerning their approval of Mayor Ford's actions in office. The total number in the sample of all the age groups is 1,045.
Part (a)
Define three events in the graph. (Select all that apply.)
The individual is between 18 and 34 years of age.
The individual is male.The individual has children.
The individual is under 18 years of age.
The individual approves of Mayor Ford.
The individual is married.
Part (b)
Describe in words what the entry 40 means.
the percent of all ages groups that disapprove of Mayor Ford
the percent of the age group 35 to 44 that approve of Mayor Ford
the percent of females that approve of Mayor Ford
the percent of males that disapprove of Mayor Ford
the percent of all age groups that approve of Mayor Ford
Part (c)
Describe in words the complement of the entry in part (b).
the percent of females that disapprove of Mayor Ford
the percent of all age groups that disapprove of Mayor Ford
the percent of all ages groups that approve of Mayor Ford
the percent of males that approve of Mayor Ford
the percent of the age group 35 to 44 that disapprove of Mayor Ford
Part (d)
Describe in words what the entry 30 means.
the percent of females between 35 and 44 years of age that approve of Mayor Ford
the percent of females that approve of Mayor Ford
the percent of the age group 18 to 34 that disapprove of Mayor Ford
the percent of males over 65 years old that disapprove of Mayor Ford
the percent of the age group 18 to 34 that approve of Mayor Ford
Part (e)
Out of the males and females, what percent are females? (Round your answer to one decimal place.)
____%
Part (f)
Out of the males, what percent disapprove of Mayor Ford? (Enter your answer as a whole number.)
____%
Part (g)
Out of all the age groups, what percent disapprove of Mayor Ford? (Enter your answer as a whole number.)
_____ %
Part (h)
Find
P(Approve|Male).
(Enter your answer to two decimal places.)
P(Approve|Male) =
Part (i)
Out of the age groups, what percent are more than 44 years old? (Round your answer to one decimal place.)
____%
Part (j)
Find
P(Approve|Age < 35).
(Enter your answer to two decimal places.)
P(Approve|Age < 35) =
Expert Answer:


