

To compare the dry braking distances from 30 to 0 miles per hour for two makes...
Fantastic news! We've Found the answer you've been seeking!
Question:
Transcribed Image Text:
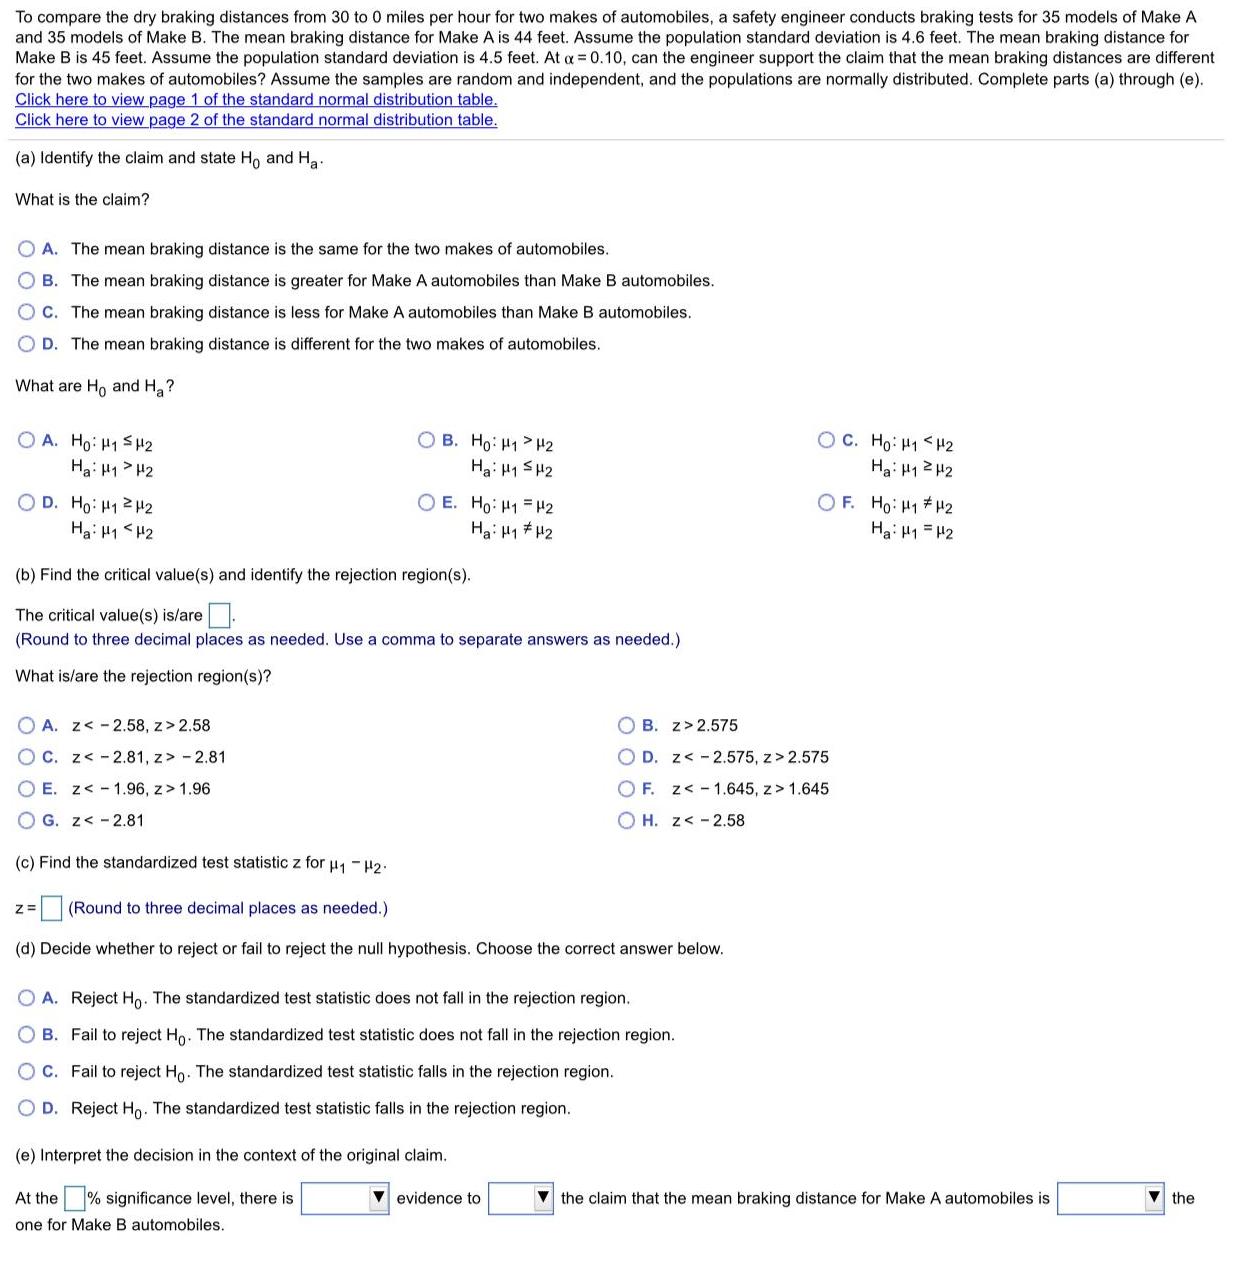
To compare the dry braking distances from 30 to 0 miles per hour for two makes of automobiles, a safety engineer conducts braking tests for 35 models of Make A and 35 models of Make B. The mean braking distance for Make A is 44 feet. Assume the population standard deviation is 4.6 feet. The mean braking distance for Make B is 45 feet. Assume the population standard deviation is 4.5 feet. At a = 0.10, can the engineer support the claim that the mean braking distances are different for the two makes of automobiles? Assume the samples are random and independent, and the populations are normally distributed. Complete parts (a) through (e). Click here to view page 1 of the standard normal distribution table. Click here to view page 2 of the standard normal distribution table. (a) Identify the claim and state Ho and Ha. What is the claim? O A. The mean braking distance is the same for the two makes of automobiles. B. The mean braking distance is greater for Make A automobiles than Make B automobiles. C. The mean braking distance is less for Make A automobiles than Make B automobiles. O D. The mean braking distance is different for the two makes of automobiles. What are Ho and Ha? O A. Ho: H1 S H2 O B. Ho: H1>H2 Ha: H1 SH2 OC. Ho: H1 <H2 Hai H1 H2 Ha: H12 H2 O E. Ho: H1 = H2 O D. Ho: H1 2 H2 Ha: H1 <H2 O F. Ho: H1 #H2 Ha: H1 = H2 Hai H1 # H2 (b) Find the critical value(s) and identify the rejection region(s). The critical value(s) is/are (Round to three decimal places as needed. Use a comma to separate answers as needed.) What is/are the rejection region(s)? O A. z< - 2.58, z> 2.58 O B. z> 2.575 O C. z< -2.81, z> - 2.81 O D. z< - 2.575, z> 2.575 O E. z< - 1.96, z> 1.96 O F. z< - 1.645, z> 1.645 O G. z< - 2.81 O H. z< - 2.58 (c) Find the standardized test statistic z foru1- #2: (Round to three decimal places as needed.) (d) Decide whether to reject or fail to reject the null hypothesis. Choose the correct answer below. O A. Reject Ho. The standardized test statistic does not fall in the rejection region. O B. Fail to reject Ho. The standardized test statistic does not fall in the rejection region. O C. Fail to reject Ho. The standardized test statistic falls in the rejection region. O D. Reject Ho. The standardized test statistic falls in the rejection region. (e) Interpret the decision in the context of the original claim. At the % significance level, there is evidence to the claim that the mean braking distance for Make A automobiles is the one for Make B automobiles. To compare the dry braking distances from 30 to 0 miles per hour for two makes of automobiles, a safety engineer conducts braking tests for 35 models of Make A and 35 models of Make B. The mean braking distance for Make A is 44 feet. Assume the population standard deviation is 4.6 feet. The mean braking distance for Make B is 45 feet. Assume the population standard deviation is 4.5 feet. At a = 0.10, can the engineer support the claim that the mean braking distances are different for the two makes of automobiles? Assume the samples are random and independent, and the populations are normally distributed. Complete parts (a) through (e). Click here to view page 1 of the standard normal distribution table. Click here to view page 2 of the standard normal distribution table. (a) Identify the claim and state Ho and Ha. What is the claim? O A. The mean braking distance is the same for the two makes of automobiles. B. The mean braking distance is greater for Make A automobiles than Make B automobiles. C. The mean braking distance is less for Make A automobiles than Make B automobiles. O D. The mean braking distance is different for the two makes of automobiles. What are Ho and Ha? O A. Ho: H1 S H2 O B. Ho: H1>H2 Ha: H1 SH2 OC. Ho: H1 <H2 Hai H1 H2 Ha: H12 H2 O E. Ho: H1 = H2 O D. Ho: H1 2 H2 Ha: H1 <H2 O F. Ho: H1 #H2 Ha: H1 = H2 Hai H1 # H2 (b) Find the critical value(s) and identify the rejection region(s). The critical value(s) is/are (Round to three decimal places as needed. Use a comma to separate answers as needed.) What is/are the rejection region(s)? O A. z< - 2.58, z> 2.58 O B. z> 2.575 O C. z< -2.81, z> - 2.81 O D. z< - 2.575, z> 2.575 O E. z< - 1.96, z> 1.96 O F. z< - 1.645, z> 1.645 O G. z< - 2.81 O H. z< - 2.58 (c) Find the standardized test statistic z foru1- #2: (Round to three decimal places as needed.) (d) Decide whether to reject or fail to reject the null hypothesis. Choose the correct answer below. O A. Reject Ho. The standardized test statistic does not fall in the rejection region. O B. Fail to reject Ho. The standardized test statistic does not fall in the rejection region. O C. Fail to reject Ho. The standardized test statistic falls in the rejection region. O D. Reject Ho. The standardized test statistic falls in the rejection region. (e) Interpret the decision in the context of the original claim. At the % significance level, there is evidence to the claim that the mean braking distance for Make A automobiles is the one for Make B automobiles.
Expert Answer:

Related Book For 

Elementary Statistics Picturing the World
ISBN: 978-0134683416
7th edition
Authors: Ron Larson, Betsy Farber
Posted Date:
Students also viewed these mathematics questions
-
To compare the dry braking distances from 60 to 0 miles per hour for two makes of automobiles, a safety engineer conducts braking tests for 23 models of Make A and 24 models of Make B. The mean...
-
To compare the dry braking distances from 30 to 0 miles per hour for two makes of automobiles, a safety engineer conducts braking tests for 35 models of Make A and 35 models of Make B. The mean...
-
To compare the dry braking distances from 30 to 0 miles per hour for two makes of automobiles, a safety engineer conducts braking tests for 35 models of Make A and 35 models of Make B. The mean...
-
Provide a detailed description of the JDBC three-tier model and its function.
-
Consider the joint probability distribution: a. Compute the marginal probability distributions for X and Y. b. Compute the covariance and correlation for X and Y. c. Compute the mean and variance for...
-
Kelowna Company has two divisions, A and B. Division A manufactures 12,000 units of product per month. The cost per unit is calculated as follows: Variable costs.................. $10 Fixed...
-
The P & A partnership does not prepare a distribution of net income statement or an owners' equity statement at the end of a fiscal period. Instead, the information is all reported in detail on the...
-
a. Based on these data, calculate the following for 2008 and 2007: 1. Days' sales in receivables 2. Accounts receivable turnover (gross receivables at year-end) 3. Days' sales in inventory 4....
-
2. What were the 10 SD's that they implemented in 2014 (10) Why was it implemented? (4)
-
A cylindrical specimen of aluminum having a diameter of 0.505 in. (12.8 mm) and a gauge length of 2.000 in. (50.800 mm) is pulled in tension. Use the load?elongation characteristics tabulated below...
-
Costington's Case Group Assignment: Prepare a three-year forecast based on Costington's actual financial statements (Exhibit 10). Note this requires that you create an entirely new spreadsheet model...
-
Martin owns a machine shop. In reviewing the shop's utility bills for the past 12 months, he found that the highest bill of $2,700 occurred in August when the machines worked 1,500 machine hours. The...
-
Assets $M Liabilities & Equity $M Income Statement $M Cash and cash equivalents 1 5 0 0 0 Checking accounts 9 5 0 0 0 Interest on loans and fees 8 5 0 0 Treasury Securities 3 5 0 0 0 NOW accounts 3...
-
For many years, Thomson Company manufactured a single product called LEC 40. Then three years ago, the company automated a portion of its plant and at the same time introduced a second product called...
-
We are evaluating a project that costs $670,000, has a life of 5 years, and has no salvage value. Assume that depreciation is straight-line to zero over the life of the project. Sales are projected...
-
Discuss techniques for achieving fault tolerance and high availability in virtualized environments. How do technologies like VMware vSphere Fault Tolerance and Microsoft Hyper-V Replica ensure...
-
What signs do you use to determine whether or not to believe the statistics in a particular advertisement?
-
What recommendations would you make to Big Four firms to help them (1) avoid confrontations with governmental officials in an authoritarian society and (2) deal effectively with such confrontations...
-
A travel analyst claims that the mean of the room rates for two adults at three-star hotels in Salt Lake City is $134. In a random sample of 37 three-star hotels in Salt Lake City, the mean room rate...
-
Eight people compete in a downhill ski race. Assuming that there are no ties, in how many different orders can the skiers finish?
-
Find the margin of error for the values of c, , and n. c = 0.95, = 5.2, n = 30
-
The Mann Corporation began operations in 2015. Information relating to the companys purchases of inventory and sales of products for 2015 and 2016 is presented below. Calculate the FIFO cost of goods...
-
The Mann Corporation began operations in 2015. Information relating to the companys purchases of inventory and sales of products for 2015 and 2016 is presented below. Calculate the LIFO cost of goods...
-
The Mann Corporation began operations in 2015.Information relating to the companys purchases of inventory and sales of products for 2015 and 2016 is presented below. Calculate the weighted-average...

Study smarter with the SolutionInn App