

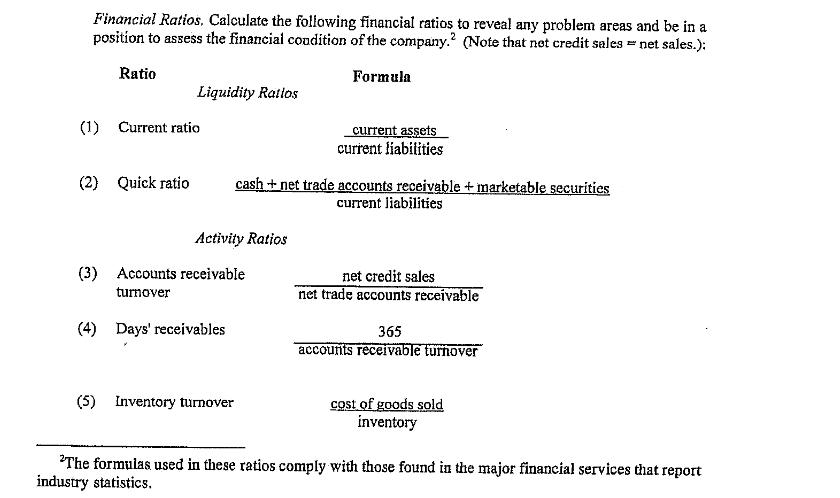
Financial Ratios. Calculate the following financial ratios to reveal any problem areas and be in a...
Fantastic news! We've Found the answer you've been seeking!
Question:
Transcribed Image Text:
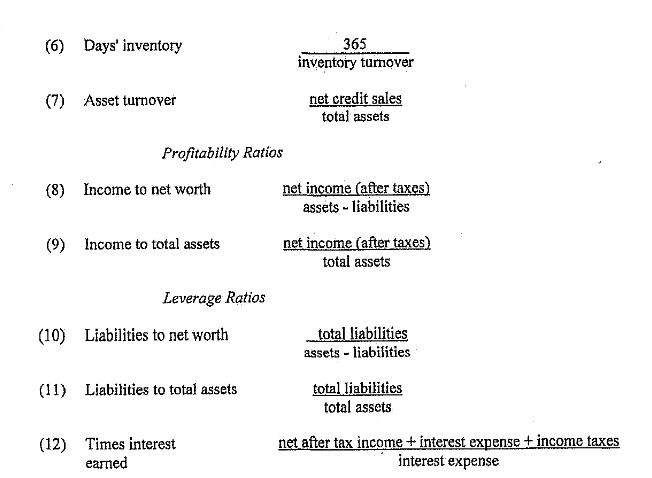
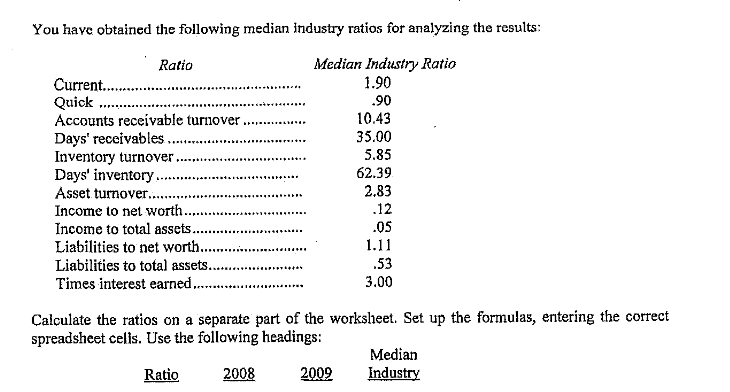
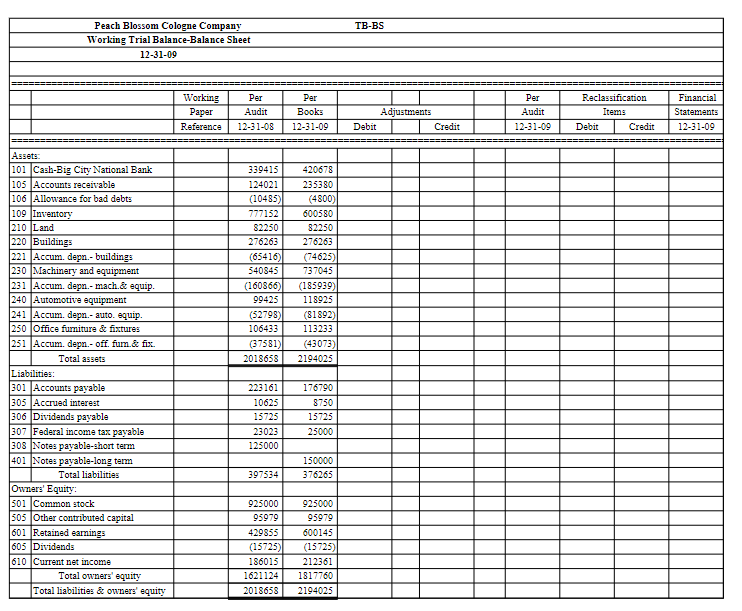
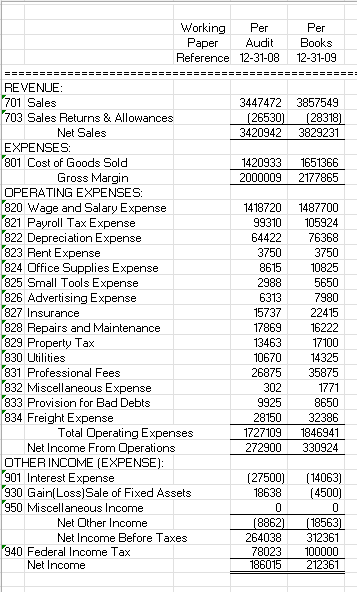
Financial Ratios. Calculate the following financial ratios to reveal any problem areas and be in a position to assess the financial condition of the company.2 (Note that net credit sales net sales.): Ratio Formula Liquidity Ratios (1) Current ratio current assets current liabilities (2) Quick ratio cashnet trade accounts receivable + marketable securities current liabilities Activity Ratios (3) Accounts receivable turnover (4) Days' receivables net credit sales net trade accounts receivable 365 accounts receivable turnover (5) Inventory turnover cost of goods sold inventory The formulas used in these ratios comply with those found in the major financial services that report industry statistics. (6) Days' inventory (7) Asset turnover Profitability Ratios (8) Income to net worth 365 inventory turnover net credit sales total assets net income (after taxes) assets - liabilities net income (after taxes) total assets (9) Income to total assets Leverage Ratios (10) Liabilities to net worth (11) Liabilities to total assets (12) Times interest earned total liabilities assets - liabilities total liabilities total assets net after tax income + interest expense + income taxes interest expense You have obtained the following median industry ratios for analyzing the results: Ratio Median Industry Ratio Current... Quick Accounts receivable turnover. Days' receivables.. Inventory turnover Days' inventory, Asset turnover...... Income to net worth......... Income to total assets. Liabilities to net worth.. Liabilities to total assets.. 1.90 .90 10.43 35.00 5.85 62.39 2.83 .12 .05 1.11 .53 3.00 Times interest earned....... Calculate the ratios on a separate part of the worksheet. Set up the formulas, entering the correct spreadsheet cells. Use the following headings: Median Ratio 2008 2009 Industry Peach Blossom Cologne Company Working Trial Balance-Balance Sheet 12-31-09 Per Working Per Paper Audit Books Reference 12-31-08 12-31-09 Assets: 101 Cash-Big City National Bank 105 Accounts receivable 106 Allowance for bad debts 109 Inventory 210 Land 220 Buildings 221 Accum. depn.- buildings 230 Machinery and equipment 231 Accum. depn.- mach.& equip. 240 Automotive equipment 339415 420678 124021 235380 (10485) (4800) 777152 600580 82250 82250 276263 276263 (65416) (74625) 540845 737045 (160866) (185939) 99425 118925 241 Accum. depn.- auto. equip. (52798) (81892) 250 Office furniture & fixtures 106433 113233 251 Accum. depn.- off. fum.& fix. (37581) (43073) Total assets 2018658 2194025 Liabilities: 301 Accounts payable 223161 176790 305 Accrued interest 10625 8750 306 Dividends payable 15725 15725 307 Federal income tax payable 23023 25000 308 Notes payable-short term 125000 401 Notes payable-long term 150000 Total liabilities 397534 376265 Owners' Equity: 501 Common stock 925000 925000 505 Other contributed capital 95979 95979 601 Retained earnings 429855 600145 605 Dividends (15725) (15725) 610 Current net income 186015 212361 Total owners' equity 1621124 1817760 Total liabilities & owners' equity 2018658 2194025 TB-BS Per Reclassification Adjustments Audit Items Financial Statements Debit Credit 12-31-09 Debit Credit 12-31-09 Working Per Per Paper Audit Books Reference 12-31-08 12-31-09 REVENUE: 701 Sales 3447472 3857549 703 Sales Returns & Allowances (26530) (28318) 3420942 3829231 EXPENSES: 1420933 1651366 Net Sales 801 Cost of Goods Sold Gross Margin OPERATING EXPENSES: 820 Wage and Salary Expense 2000009 2177865 1418720 1487700 821 Payroll Tax Expense 99310 105924 822 Depreciation Expense 64422 76368 823 Rent Expense 3750 3750 824 Office Supplies Expense 8615 10825 825 Small Tools Expense 2988 5650 826 Advertising Expense 6313 7980 827 Insurance 15737 22415 828 Repairs and Maintenance 17869 16222 829 Property Tax 13463 17100 830 Utilities 10670 14325 831 Professional Fees 26875 35875 832 Miscellaneous Expense 302 1771 834 Freight Expense 833 Provision for Bad Debts Total Operating Expenses 9925 8650 28150 32386 1727109 1846941 Net Income From Operations 272900 330924 OTHER INCOME (EXPENSE): 901 Interest Expense (27500) (14063) 930 Gain(Loss) Sale of Fixed Assets 18638 (4500) 950 Miscellaneous Income 0 0 Net Other Income (8862) [18563) Net Income Before Taxes 264038 312361 940 Federal Income Tax 78023 100000 Net Income 186015 212361 Financial Ratios. Calculate the following financial ratios to reveal any problem areas and be in a position to assess the financial condition of the company.2 (Note that net credit sales net sales.): Ratio Formula Liquidity Ratios (1) Current ratio current assets current liabilities (2) Quick ratio cashnet trade accounts receivable + marketable securities current liabilities Activity Ratios (3) Accounts receivable turnover (4) Days' receivables net credit sales net trade accounts receivable 365 accounts receivable turnover (5) Inventory turnover cost of goods sold inventory The formulas used in these ratios comply with those found in the major financial services that report industry statistics. (6) Days' inventory (7) Asset turnover Profitability Ratios (8) Income to net worth 365 inventory turnover net credit sales total assets net income (after taxes) assets - liabilities net income (after taxes) total assets (9) Income to total assets Leverage Ratios (10) Liabilities to net worth (11) Liabilities to total assets (12) Times interest earned total liabilities assets - liabilities total liabilities total assets net after tax income + interest expense + income taxes interest expense You have obtained the following median industry ratios for analyzing the results: Ratio Median Industry Ratio Current... Quick Accounts receivable turnover. Days' receivables.. Inventory turnover Days' inventory, Asset turnover...... Income to net worth......... Income to total assets. Liabilities to net worth.. Liabilities to total assets.. 1.90 .90 10.43 35.00 5.85 62.39 2.83 .12 .05 1.11 .53 3.00 Times interest earned....... Calculate the ratios on a separate part of the worksheet. Set up the formulas, entering the correct spreadsheet cells. Use the following headings: Median Ratio 2008 2009 Industry Peach Blossom Cologne Company Working Trial Balance-Balance Sheet 12-31-09 Per Working Per Paper Audit Books Reference 12-31-08 12-31-09 Assets: 101 Cash-Big City National Bank 105 Accounts receivable 106 Allowance for bad debts 109 Inventory 210 Land 220 Buildings 221 Accum. depn.- buildings 230 Machinery and equipment 231 Accum. depn.- mach.& equip. 240 Automotive equipment 339415 420678 124021 235380 (10485) (4800) 777152 600580 82250 82250 276263 276263 (65416) (74625) 540845 737045 (160866) (185939) 99425 118925 241 Accum. depn.- auto. equip. (52798) (81892) 250 Office furniture & fixtures 106433 113233 251 Accum. depn.- off. fum.& fix. (37581) (43073) Total assets 2018658 2194025 Liabilities: 301 Accounts payable 223161 176790 305 Accrued interest 10625 8750 306 Dividends payable 15725 15725 307 Federal income tax payable 23023 25000 308 Notes payable-short term 125000 401 Notes payable-long term 150000 Total liabilities 397534 376265 Owners' Equity: 501 Common stock 925000 925000 505 Other contributed capital 95979 95979 601 Retained earnings 429855 600145 605 Dividends (15725) (15725) 610 Current net income 186015 212361 Total owners' equity 1621124 1817760 Total liabilities & owners' equity 2018658 2194025 TB-BS Per Reclassification Adjustments Audit Items Financial Statements Debit Credit 12-31-09 Debit Credit 12-31-09 Working Per Per Paper Audit Books Reference 12-31-08 12-31-09 REVENUE: 701 Sales 3447472 3857549 703 Sales Returns & Allowances (26530) (28318) 3420942 3829231 EXPENSES: 1420933 1651366 Net Sales 801 Cost of Goods Sold Gross Margin OPERATING EXPENSES: 820 Wage and Salary Expense 2000009 2177865 1418720 1487700 821 Payroll Tax Expense 99310 105924 822 Depreciation Expense 64422 76368 823 Rent Expense 3750 3750 824 Office Supplies Expense 8615 10825 825 Small Tools Expense 2988 5650 826 Advertising Expense 6313 7980 827 Insurance 15737 22415 828 Repairs and Maintenance 17869 16222 829 Property Tax 13463 17100 830 Utilities 10670 14325 831 Professional Fees 26875 35875 832 Miscellaneous Expense 302 1771 834 Freight Expense 833 Provision for Bad Debts Total Operating Expenses 9925 8650 28150 32386 1727109 1846941 Net Income From Operations 272900 330924 OTHER INCOME (EXPENSE): 901 Interest Expense (27500) (14063) 930 Gain(Loss) Sale of Fixed Assets 18638 (4500) 950 Miscellaneous Income 0 0 Net Other Income (8862) [18563) Net Income Before Taxes 264038 312361 940 Federal Income Tax 78023 100000 Net Income 186015 212361
Expert Answer:

Related Book For 
Auditing a risk based approach to conducting a quality audit
ISBN: 978-1133939153
9th edition
Authors: Karla Johnstone, Audrey Gramling, Larry Rittenberg
Posted Date:
Students also viewed these finance questions
-
Managing Scope Changes Case Study Scope changes on a project can occur regardless of how well the project is planned or executed. Scope changes can be the result of something that was omitted during...
-
The Crazy Eddie fraud may appear smaller and gentler than the massive billion-dollar frauds exposed in recent times, such as Bernie Madoffs Ponzi scheme, frauds in the subprime mortgage market, the...
-
In Exercises find the derivative of the function. y = x(x + 1)
-
a. Which fund's returns are best explained by the market's returns? Consider the five funds shown below: b. Which fund had the largest total risk? c. Which fund had the lowest market risk the...
-
A company has the following information in its records. Certain data have been intentionally omitted ($ in thousands). Required: Determine the missing numbers. Show computations where appropriate....
-
During January through June, (non-leap year) a 50-bed hospital had 9,001 inpatient service days. What is the percentage of occupancy? Round to one decimal place.
-
Radial flow between parallel disks (Fig. 3B.10). A part of a lubrication system consists of two circular disks between which a lubricant flows radially. The flow takes place because of a modified...
-
01. Illustrate changes in formi level for I and N type semiconductors "with temperature.
-
Y Name the aldehyde displayed below. Enter the name. View Available Hint(s) Submit Part B The ketone displayed below could potentially have any of the names listed. Choose the name that follows...
-
Identify five managers that have the title project manager and another five that are project managers but dont carry the title. Do you notice any differences in their roles?
-
What is the advantage of the Maslen method over the Newtonian impact theory?
-
Conducting carbon nanotubes with an aspect ratio of \(\beta=200\) are dispersed in a polylactide matrix, a nonconducting biopolymer. If the dispersion is random (not an easy thing to achieve) what...
-
Discuss the 'transonic dip' phenomenon for the swept wing in a transonic unsteady flow.
-
Lets face it, some people find it easier to work in teams than others. Are you already a team player, or have you not yet developed the skills needed to work effectively with others in teams? Knowing...
-
Watch - Amy e. Herman's Tedtalk, "how art can help you analyze." Youtube, in order to write this paper, Review: - The entire list of talks on the "creative spark" ted channel. Select - one talk that...
-
Use translations to graph f. f(x) = x-/2 +1
-
Explain the procedure for drawing the Mohrs circle under biaxial loading.
-
Based on the regression estimate in Problem 4, evaluate the statistical significance of the estimated coefficients in the regression.
-
Explain the procedure for drawing Mohrs circle under complex stresses.

Study smarter with the SolutionInn App