

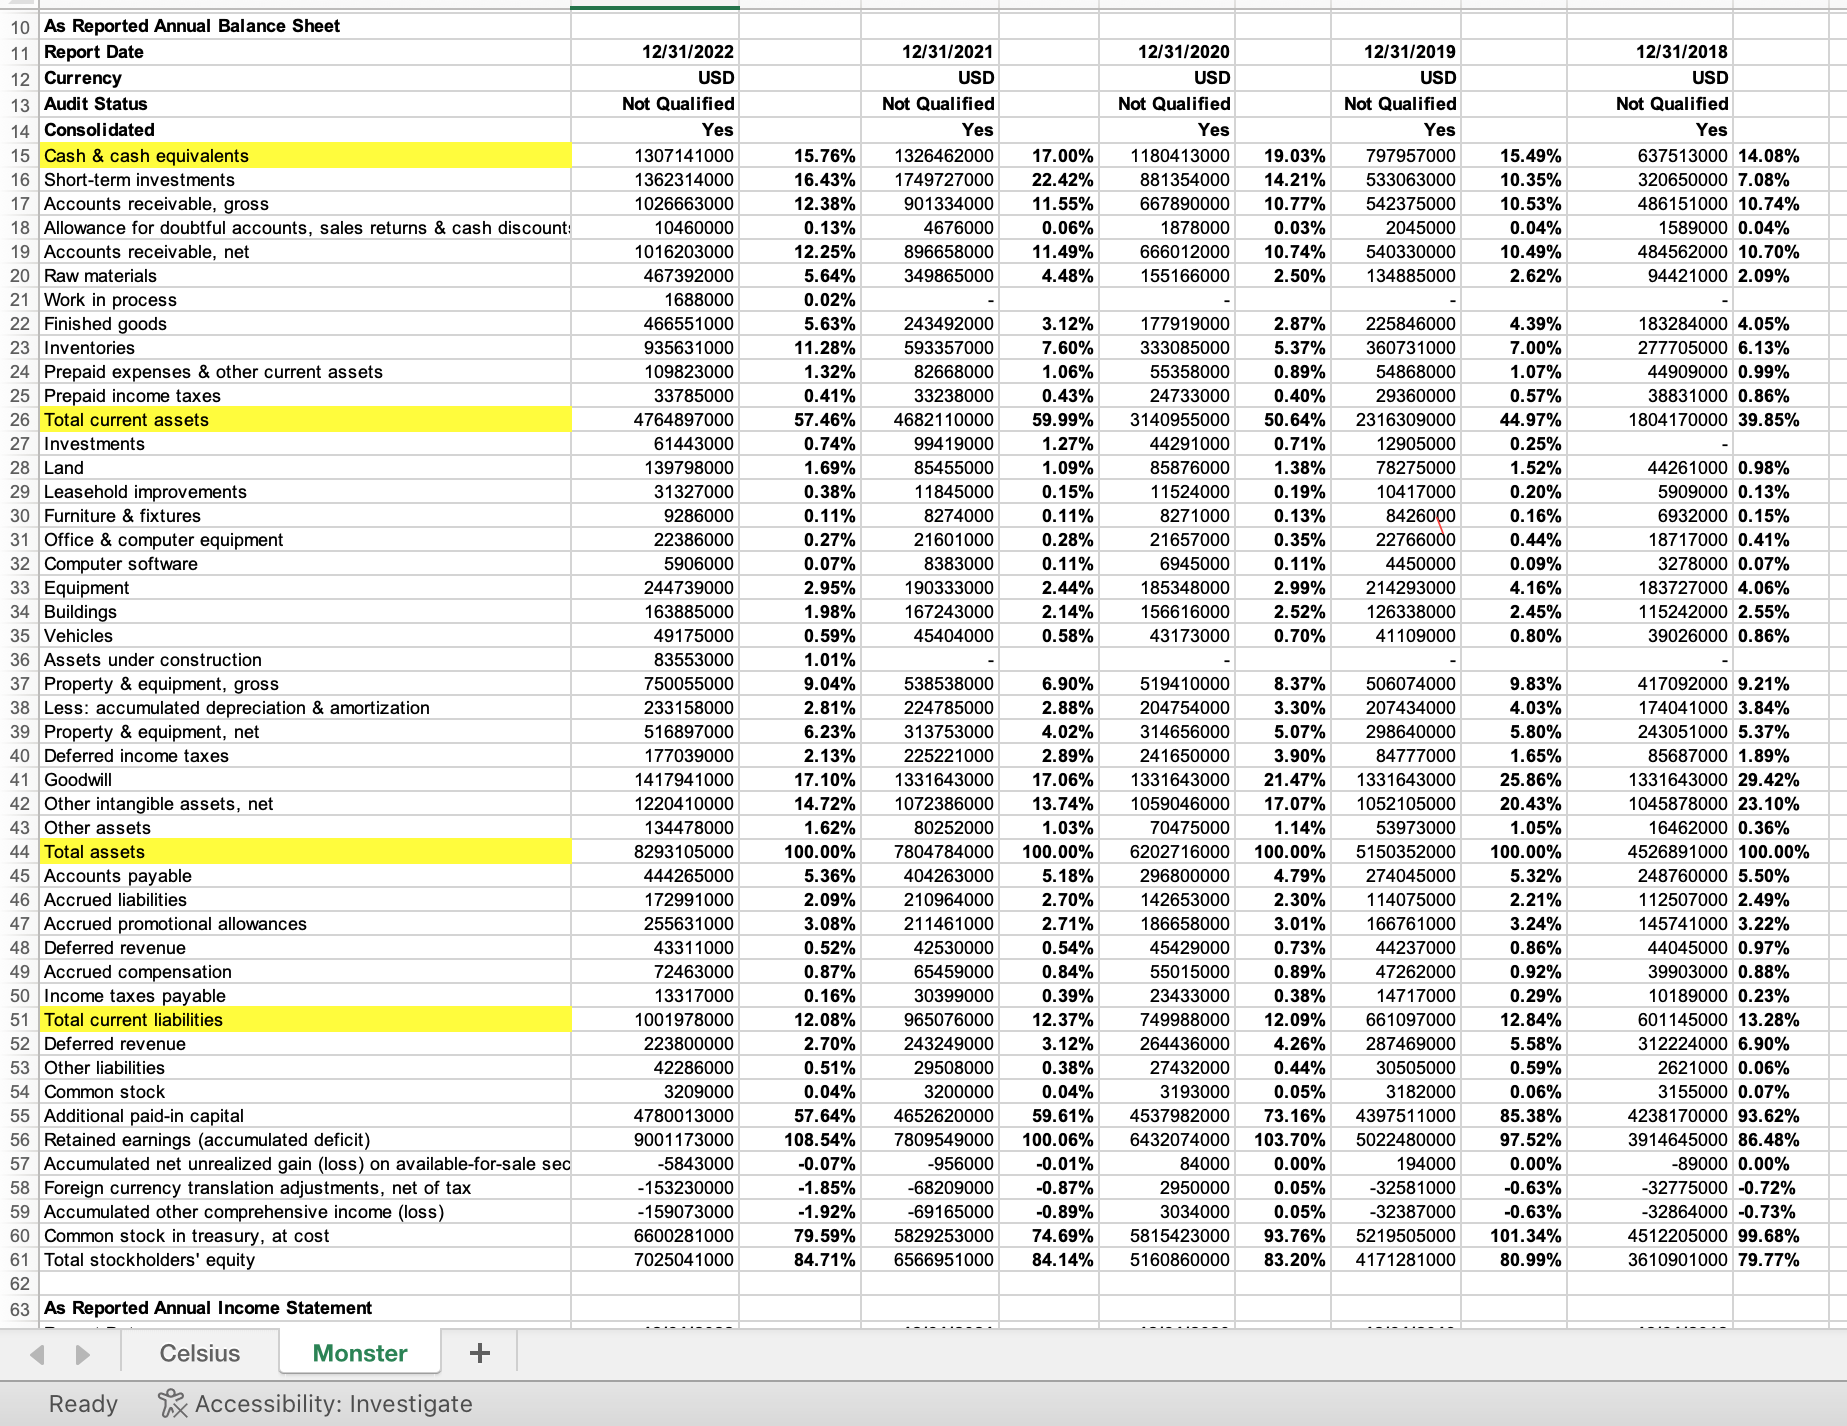
find total liabilities and stockholders' equity deficit a 10 As Reported Annual Balance Sheet 11 Report Date
Fantastic news! We've Found the answer you've been seeking!
Question:
find total liabilities and stockholders' equity deficit a
Transcribed Image Text:
10 As Reported Annual Balance Sheet 11 Report Date 12 Currency 13 Audit Status 14 Consolidated 15 Cash & cash equivalents 16 Short-term investments 17 Accounts receivable, gross 18 Allowance for doubtful accounts, sales returns & cash discount: 19 Accounts receivable, net 20 Raw materials 21 Work in process 22 Finished goods 23 Inventories 12/31/2022 USD Not Qualified 12/31/2021 USD 12/31/2020 USD 12/31/2019 USD Not Qualified Not Qualified Yes Yes Yes 1307141000 1362314000 1026663000 10460000 1016203000 467392000 1688000 466551000 935631000 24 Prepaid expenses & other current assets 25 Prepaid income taxes 26 Total current assets 27 Investments 28 Land 29 Leasehold improvements 30 Furniture & fixtures 31 Office & computer equipment 32 Computer software 33 Equipment 34 Buildings 35 Vehicles 36 Assets under construction 109823000 33785000 4764897000 61443000 139798000 15.76% 16.43% 12.38% 0.13% 12.25% 5.64% 0.02% 5.63% 11.28% 1.32% 0.41% 57.46% 0.74% 1.69% 1326462000 17.00% 1749727000 22.42% 901334000 11.55% 4676000 0.06% 896658000 11.49% 349865000 4.48% 1180413000 19.03% 881354000 14.21% 667890000 10.77% 1878000 0.03% 666012000 10.74% 155166000 2.50% Not Qualified Yes 797957000 533063000 542375000 2045000 540330000 134885000 12/31/2018 USD Not Qualified Yes 15.49% 637513000 14.08% 10.35% 320650000 7.08% 10.53% 0.04% 10.49% 2.62% 486151000 10.74% 1589000 0.04% 484562000 10.70% 94421000 2.09% 31327000 0.38% 243492000 3.12% 593357000 7.60% 82668000 1.06% 33238000 0.43% 4682110000 59.99% 99419000 1.27% 85455000 1.09% 11845000 0.15% 9286000 0.11% 8274000 0.11% 22386000 0.27% 21601000 0.28% 177919000 2.87% 333085000 5.37% 55358000 0.89% 24733000 0.40% 3140955000 50.64% 44291000 0.71% 85876000 1.38% 11524000 0.19% 8271000 0.13% 21657000 0.35% 225846000 360731000 54868000 4.39% 7.00% 1.07% 183284000 4.05% 277705000 6.13% 44909000 0.99% 29360000 2316309000 12905000 78275000 10417000 0.57% 44.97% 0.25% 1.52% 38831000 0.86% 1804170000 39.85% 44261000 0.98% 0.20% 5909000 0.13% 8426000 0.16% 6932000 0.15% 22766000 5906000 0.07% 8383000 0.11% 6945000 0.11% 4450000 244739000 2.95% 190333000 2.44% 163885000 1.98% 49175000 0.59% 167243000 45404000 2.14% 0.58% 185348000 156616000 43173000 2.99% 2.52% 0.70% 214293000 126338000 41109000 0.44% 0.09% 4.16% 2.45% 0.80% 18717000 0.41% 3278000 0.07% 183727000 4.06% 115242000 2.55% 39026000 0.86% 83553000 1.01% 37 Property & equipment, gross 750055000 9.04% 38 Less: accumulated depreciation & amortization 233158000 2.81% 39 Property & equipment, net 516897000 40 Deferred income taxes 41 Goodwill 43 Other assets 44 Total assets 177039000 1417941000 6.23% 2.13% 17.10% 42 Other intangible assets, net 1220410000 14.72% 45 Accounts payable 134478000 8293105000 444265000 1.62% 100.00% 5.36% 46 Accrued liabilities 172991000 2.09% 47 Accrued promotional allowances 255631000 3.08% 48 Deferred revenue 43311000 0.52% 49 Accrued compensation 72463000 50 Income taxes payable 13317000 0.87% 0.16% 51 Total current liabilities 1001978000 12.08% 52 Deferred revenue 53 Other liabilities 223800000 2.70% 42286000 0.51% 54 Common stock 55 Additional paid-in capital 56 Retained earnings (accumulated deficit) 3209000 0.04% 4780013000 57.64% 9001173000 108.54% 7809549000 57 Accumulated net unrealized gain (loss) on available-for-sale sec 58 Foreign currency translation adjustments, net of tax 59 Accumulated other comprehensive income (loss) -5843000 -153230000 -159073000 60 Common stock in treasury, at cost 61 Total stockholders' equity 62 63 As Reported Annual Income Statement 6600281000 7025041000 538538000 6.90% 224785000 2.88% 313753000 4.02% 225221000 2.89% 1331643000 17.06% 1072386000 13.74% 80252000 1.03% 7804784000 100.00% 404263000 5.18% 210964000 2.70% 211461000 2.71% 42530000 0.54% 65459000 0.84% 30399000 0.39% 965076000 12.37% 243249000 3.12% 29508000 0.38% 3200000 0.04% 4652620000 59.61% 100.06% -0.07% -956000 -0.01% -1.85% -68209000 -0.87% -1.92% -69165000 -0.89% 79.59% 5829253000 74.69% 519410000 204754000 314656000 241650000 1331643000 1059046000 70475000 6202716000 296800000 142653000 186658000 45429000 0.73% 55015000 0.89% 23433000 0.38% 749988000 12.09% 264436000 4.26% 27432000 0.44% 3193000 0.05% 4537982000 73.16% 6432074000 8.37% 506074000 3.30% 207434000 5.07% 298640000 3.90% 84777000 21.47% 1331643000 17.07% 1052105000 1.14% 53973000 100.00% 5150352000 4.79% 274045000 2.30% 114075000 3.01% 9.83% 4.03% 417092000 9.21% 174041000 3.84% 5.80% 243051000 5.37% 1.65% 25.86% 20.43% 85687000 1.89% 1331643000 29.42% 1045878000 23.10% 1.05% 100.00% 16462000 0.36% 4526891000 100.00% 5.32% 248760000 5.50% 2.21% 112507000 2.49% 166761000 3.24% 145741000 3.22% 44237000 0.86% 44045000 0.97% 103.70% 47262000 14717000 661097000 287469000 30505000 3182000 4397511000 5022480000 0.92% 39903000 0.88% 0.29% 12.84% 5.58% 0.59% 0.06% 85.38% 10189000 0.23% 601145000 13.28% 312224000 6.90% 2621000 0.06% 3155000 0.07% 97.52% 84000 2950000 3034000 5815423000 84.71% 6566951000 84.14% 5160860000 83.20% 0.00% 0.05% 0.05% 93.76% 194000 0.00% 4238170000 93.62% 3914645000 86.48% -89000 0.00% -32581000 -32387000 -0.63% -32775000 -0.72% 5219505000 4171281000 -0.63% 101.34% -32864000 -0.73% 4512205000 99.68% 80.99% 3610901000 79.77% Celsius Ready Monster Accessibility: Investigate 10 As Reported Annual Balance Sheet 11 Report Date 12 Currency 13 Audit Status 14 Consolidated 15 Cash & cash equivalents 16 Short-term investments 17 Accounts receivable, gross 18 Allowance for doubtful accounts, sales returns & cash discount: 19 Accounts receivable, net 20 Raw materials 21 Work in process 22 Finished goods 23 Inventories 12/31/2022 USD Not Qualified 12/31/2021 USD 12/31/2020 USD 12/31/2019 USD Not Qualified Not Qualified Yes Yes Yes 1307141000 1362314000 1026663000 10460000 1016203000 467392000 1688000 466551000 935631000 24 Prepaid expenses & other current assets 25 Prepaid income taxes 26 Total current assets 27 Investments 28 Land 29 Leasehold improvements 30 Furniture & fixtures 31 Office & computer equipment 32 Computer software 33 Equipment 34 Buildings 35 Vehicles 36 Assets under construction 109823000 33785000 4764897000 61443000 139798000 15.76% 16.43% 12.38% 0.13% 12.25% 5.64% 0.02% 5.63% 11.28% 1.32% 0.41% 57.46% 0.74% 1.69% 1326462000 17.00% 1749727000 22.42% 901334000 11.55% 4676000 0.06% 896658000 11.49% 349865000 4.48% 1180413000 19.03% 881354000 14.21% 667890000 10.77% 1878000 0.03% 666012000 10.74% 155166000 2.50% Not Qualified Yes 797957000 533063000 542375000 2045000 540330000 134885000 12/31/2018 USD Not Qualified Yes 15.49% 637513000 14.08% 10.35% 320650000 7.08% 10.53% 0.04% 10.49% 2.62% 486151000 10.74% 1589000 0.04% 484562000 10.70% 94421000 2.09% 31327000 0.38% 243492000 3.12% 593357000 7.60% 82668000 1.06% 33238000 0.43% 4682110000 59.99% 99419000 1.27% 85455000 1.09% 11845000 0.15% 9286000 0.11% 8274000 0.11% 22386000 0.27% 21601000 0.28% 177919000 2.87% 333085000 5.37% 55358000 0.89% 24733000 0.40% 3140955000 50.64% 44291000 0.71% 85876000 1.38% 11524000 0.19% 8271000 0.13% 21657000 0.35% 225846000 360731000 54868000 4.39% 7.00% 1.07% 183284000 4.05% 277705000 6.13% 44909000 0.99% 29360000 2316309000 12905000 78275000 10417000 0.57% 44.97% 0.25% 1.52% 38831000 0.86% 1804170000 39.85% 44261000 0.98% 0.20% 5909000 0.13% 8426000 0.16% 6932000 0.15% 22766000 5906000 0.07% 8383000 0.11% 6945000 0.11% 4450000 244739000 2.95% 190333000 2.44% 163885000 1.98% 49175000 0.59% 167243000 45404000 2.14% 0.58% 185348000 156616000 43173000 2.99% 2.52% 0.70% 214293000 126338000 41109000 0.44% 0.09% 4.16% 2.45% 0.80% 18717000 0.41% 3278000 0.07% 183727000 4.06% 115242000 2.55% 39026000 0.86% 83553000 1.01% 37 Property & equipment, gross 750055000 9.04% 38 Less: accumulated depreciation & amortization 233158000 2.81% 39 Property & equipment, net 516897000 40 Deferred income taxes 41 Goodwill 43 Other assets 44 Total assets 177039000 1417941000 6.23% 2.13% 17.10% 42 Other intangible assets, net 1220410000 14.72% 45 Accounts payable 134478000 8293105000 444265000 1.62% 100.00% 5.36% 46 Accrued liabilities 172991000 2.09% 47 Accrued promotional allowances 255631000 3.08% 48 Deferred revenue 43311000 0.52% 49 Accrued compensation 72463000 50 Income taxes payable 13317000 0.87% 0.16% 51 Total current liabilities 1001978000 12.08% 52 Deferred revenue 53 Other liabilities 223800000 2.70% 42286000 0.51% 54 Common stock 55 Additional paid-in capital 56 Retained earnings (accumulated deficit) 3209000 0.04% 4780013000 57.64% 9001173000 108.54% 7809549000 57 Accumulated net unrealized gain (loss) on available-for-sale sec 58 Foreign currency translation adjustments, net of tax 59 Accumulated other comprehensive income (loss) -5843000 -153230000 -159073000 60 Common stock in treasury, at cost 61 Total stockholders' equity 62 63 As Reported Annual Income Statement 6600281000 7025041000 538538000 6.90% 224785000 2.88% 313753000 4.02% 225221000 2.89% 1331643000 17.06% 1072386000 13.74% 80252000 1.03% 7804784000 100.00% 404263000 5.18% 210964000 2.70% 211461000 2.71% 42530000 0.54% 65459000 0.84% 30399000 0.39% 965076000 12.37% 243249000 3.12% 29508000 0.38% 3200000 0.04% 4652620000 59.61% 100.06% -0.07% -956000 -0.01% -1.85% -68209000 -0.87% -1.92% -69165000 -0.89% 79.59% 5829253000 74.69% 519410000 204754000 314656000 241650000 1331643000 1059046000 70475000 6202716000 296800000 142653000 186658000 45429000 0.73% 55015000 0.89% 23433000 0.38% 749988000 12.09% 264436000 4.26% 27432000 0.44% 3193000 0.05% 4537982000 73.16% 6432074000 8.37% 506074000 3.30% 207434000 5.07% 298640000 3.90% 84777000 21.47% 1331643000 17.07% 1052105000 1.14% 53973000 100.00% 5150352000 4.79% 274045000 2.30% 114075000 3.01% 9.83% 4.03% 417092000 9.21% 174041000 3.84% 5.80% 243051000 5.37% 1.65% 25.86% 20.43% 85687000 1.89% 1331643000 29.42% 1045878000 23.10% 1.05% 100.00% 16462000 0.36% 4526891000 100.00% 5.32% 248760000 5.50% 2.21% 112507000 2.49% 166761000 3.24% 145741000 3.22% 44237000 0.86% 44045000 0.97% 103.70% 47262000 14717000 661097000 287469000 30505000 3182000 4397511000 5022480000 0.92% 39903000 0.88% 0.29% 12.84% 5.58% 0.59% 0.06% 85.38% 10189000 0.23% 601145000 13.28% 312224000 6.90% 2621000 0.06% 3155000 0.07% 97.52% 84000 2950000 3034000 5815423000 84.71% 6566951000 84.14% 5160860000 83.20% 0.00% 0.05% 0.05% 93.76% 194000 0.00% 4238170000 93.62% 3914645000 86.48% -89000 0.00% -32581000 -32387000 -0.63% -32775000 -0.72% 5219505000 4171281000 -0.63% 101.34% -32864000 -0.73% 4512205000 99.68% 80.99% 3610901000 79.77% Celsius Ready Monster Accessibility: Investigate
Expert Answer:

Related Book For 
Fundamentals of Corporate Finance
ISBN: 978-0133400694
1st canadian edition
Authors: Jonathan Berk, Peter DeMarzo, Jarrad Harford, David A. Stangeland, Andras Marosi
Posted Date:
Students also viewed these finance questions
-
This assignment requires you to complete the 2022 tax reporting for a fictional woman named Anna Smith. Question 1 T1 - step 4 - line 66 This is Anna's taxable income Answer: Question 2 T1 - step...
-
The number of hours of daylight that occur at any location on Earth depends on the time of year and the latitude of the location. The equations below model the numbers of hours of daylight in Seward,...
-
(-7/25) (-5/21) Perform the indicated operation by hand.
-
Yilmaz A.S. encounters the following situations: 1. Yilmaz collects 1,750 from a customer in 2017 for services to be performed in 2018. 2. Yilmaz incurs utility expense which is not yet paid in cash...
-
Although once unusual, write-downs of impaired assets increased markedly in the first half of the 1980s. For example, D. Fried, M. Schiff, and A. C. Sondhi, in "Impairments and Writeoffs of...
-
Buchanan Company recently was sued by a competitor for patent infringement. Attorneys have determined that it is probable that Buchanan will lose the case and that a reasonable estimate of damages to...
-
Understanding and preparing financial statements for single-entity limited companies. The following is the trial balance of Minxiama Ltd at 31 December 2022. Minxiama Ltd Trial balance at 31...
-
3. Primes Write a program that finds and prints all of the prime numbers between 3 and 100. A prime number is a number such that one and itself are the only numbers that evenly divide it (e.g.,...
-
As a synthesis, think and explain the following condition: 1. A crystal salt consists of negative and positive ions. How does the net charge of the negative ions compare with that of the positive...
-
Ron Marden and Tip Baker operate separate auto repair shops. On January 1, 2020, they decide to combine their separate businesses which were operated as proprietorships to form M & B Auto Repair, a...
-
Complete a regression analysis to determine total annual fixed and variable costs using the sales revenue and wage costs shown below. Sales Revenue Wage Costs January 24,900 11,300 February 24,200...
-
Coca Cola's dividend is $1/share per quarter. On average, the dividends are expected to grow by 2% per quarter. Assuming the expected return of the stock is 5% per quarter. What is the share price...
-
Suppose a company is choosing between bank loans and bonds. A bank is offering an interest rate of 4.5% to lend the money to the firm and requires the company to post collateral and comply with...
-
List and briefly describe the stages in the five-stage model of group development
-
Use Stokes' Theorem to evaluate f(y+sin x) dx+(z+cos y) dy+rdz, where C is the rve r(t) = (sint, cost, sin 2t), t = [0, 2].
-
Consider a scenario where an online trade application is being developed. The two registered users can negotiate over the price of a product being traded. Create a class diagram for this application...
-
Consider a scenario where you negotiate with a company over the salary and perks being offered for a position. Create a class diagram for this using negotiation patterns as your base and draw a...
-
What are the three foundation concepts of stability model?

Study smarter with the SolutionInn App