

First, identify which variables you will analyze for your study. Choose an outcome variable (disease or...
Fantastic news! We've Found the answer you've been seeking!
Question:

Transcribed Image Text:
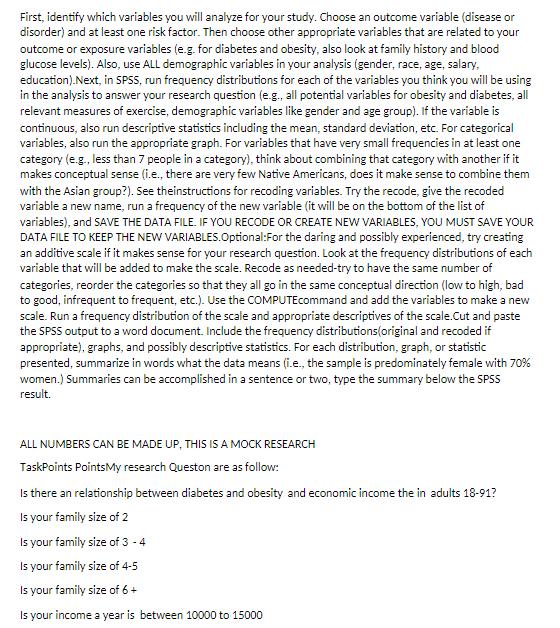
First, identify which variables you will analyze for your study. Choose an outcome variable (disease or disorder) and at least one risk factor. Then choose other appropriate variables that are related to your outcome or exposure variables (e.g. for diabetes and obesity, also look at family history and blood glucose levels). Also, use ALL demographic variables in your analysis (gender, race, age, salary, education).Next, in SPSS, run frequency distributions for each of the variables you think you will be using in the analysis to answer your research question (e.g., all potential variables for obesity and diabetes, all relevant measures of exercise, demographic variables like gender and age group). If the variable is continuous, also run descriptive statistics including the mean, standard deviation, etc. For categorical variables, also run the appropriate graph. For variables that have very small frequencies in at least one category (e.g., less than 7 people in a category), think about combining that category with another if it makes conceptual sense (i.e., there are very few Native Americans, does it make sense to combine them with the Asian group?). See theinstructions for recoding variables. Try the recode, give the recoded variable a new name, run a frequency of the new variable (it will be on the bottom of the list of variables), and SAVE THE DATA FILE. IF YOU RECODE OR CREATE NEW VARIABLES, YOOU MUST SAVE YOUR DATA FILE TO KEEP THE NEW VARIABLES.Optional:For the daring and possibly experienced, try creating an additive scale if it makes sense for your research question. Look at the frequency distributions of each variable that will be added to make the scale. Recode as needed-try to have the same number of categories, reorder the categories so that they all go in the same conceptual direction (low to high, bad to good, infrequent to frequent, etc.). Use the COMPUTEcommand and add the variables to make a new scale. Run a frequency distribution of the scale and appropriate descriptives of the scale.Cut and paste the SPSS output to a word document. Include the frequency distributions(original and recoded if appropriate), graphs, and possibly descriptive statistics. For each distribution, graph, or statistic presented, summarize in words what the data means (i.e., the sample is predominately female with 70% women.) Summaries can be accomplished in a sentence or two, type the summary below the SPSS result. ALL NUMBERS CAN BE MADE UP, THIS IS A MOCK RESEARCH TaskPoints PointsMy research Queston are as follow: Is there an relationship between diabetes and obesity and economic income the in adults 18-91? Is your family size of 2 Is your family size of 3 - 4 Is your family size of 4-5 Is your family size of 6+ Is your income a year is between 10000 to 15000 Is your income a year is between 15000 to 25000 Is your income a year is between 25000 to 35000 Is your income a year is between 35000 to 45000 Is your income a year is between 45000 to 55000 Is your income a year is between 55000 to 65000 Is your income a year is between 6500 to 85000 Is your income a year is more than 100000 plus My selecTed Variables are as follow: obesity Physical AcitviTy (PA) Low income (Ili) BMI, DiabeTes, Gender Age the Cohort is N=200. the race and are you currently in school from the table with the mean, SD, etc. since they are categorical variables. Also for the descriptive statistics table with physical activity and sleep apnea it is the same thing-theyare categorical so can't have a mean and SD. They should just be frequency without measures of central tendency. ForDo you include Physical Activity into your dailythat shouldn't be observed/expected as you are not comparing it to a known external value. Use the Test of Independence which doesn't include observed/expected values. Cronbach's alpha is not appropriate for this - you can eliminate it. First, identify which variables you will analyze for your study. Choose an outcome variable (disease or disorder) and at least one risk factor. Then choose other appropriate variables that are related to your outcome or exposure variables (e.g. for diabetes and obesity, also look at family history and blood glucose levels). Also, use ALL demographic variables in your analysis (gender, race, age, salary, education).Next, in SPSS, run frequency distributions for each of the variables you think you will be using in the analysis to answer your research question (e.g., all potential variables for obesity and diabetes, all relevant measures of exercise, demographic variables like gender and age group). If the variable is continuous, also run descriptive statistics including the mean, standard deviation, etc. For categorical variables, also run the appropriate graph. For variables that have very small frequencies in at least one category (e.g., less than 7 people in a category), think about combining that category with another if it makes conceptual sense (i.e., there are very few Native Americans, does it make sense to combine them with the Asian group?). See theinstructions for recoding variables. Try the recode, give the recoded variable a new name, run a frequency of the new variable (it will be on the bottom of the list of variables), and SAVE THE DATA FILE. IF YOU RECODE OR CREATE NEW VARIABLES, YOOU MUST SAVE YOUR DATA FILE TO KEEP THE NEW VARIABLES.Optional:For the daring and possibly experienced, try creating an additive scale if it makes sense for your research question. Look at the frequency distributions of each variable that will be added to make the scale. Recode as needed-try to have the same number of categories, reorder the categories so that they all go in the same conceptual direction (low to high, bad to good, infrequent to frequent, etc.). Use the COMPUTEcommand and add the variables to make a new scale. Run a frequency distribution of the scale and appropriate descriptives of the scale.Cut and paste the SPSS output to a word document. Include the frequency distributions(original and recoded if appropriate), graphs, and possibly descriptive statistics. For each distribution, graph, or statistic presented, summarize in words what the data means (i.e., the sample is predominately female with 70% women.) Summaries can be accomplished in a sentence or two, type the summary below the SPSS result. ALL NUMBERS CAN BE MADE UP, THIS IS A MOCK RESEARCH TaskPoints PointsMy research Queston are as follow: Is there an relationship between diabetes and obesity and economic income the in adults 18-91? Is your family size of 2 Is your family size of 3 - 4 Is your family size of 4-5 Is your family size of 6+ Is your income a year is between 10000 to 15000 Is your income a year is between 15000 to 25000 Is your income a year is between 25000 to 35000 Is your income a year is between 35000 to 45000 Is your income a year is between 45000 to 55000 Is your income a year is between 55000 to 65000 Is your income a year is between 6500 to 85000 Is your income a year is more than 100000 plus My selecTed Variables are as follow: obesity Physical AcitviTy (PA) Low income (Ili) BMI, DiabeTes, Gender Age the Cohort is N=200. the race and are you currently in school from the table with the mean, SD, etc. since they are categorical variables. Also for the descriptive statistics table with physical activity and sleep apnea it is the same thing-theyare categorical so can't have a mean and SD. They should just be frequency without measures of central tendency. ForDo you include Physical Activity into your dailythat shouldn't be observed/expected as you are not comparing it to a known external value. Use the Test of Independence which doesn't include observed/expected values. Cronbach's alpha is not appropriate for this - you can eliminate it.
Expert Answer:
Answer rating: 100% (QA)
Phenyl ketonuria Individual lack enzyme which is responsible for convers... View the full answer

Related Book For 

Posted Date:
Students also viewed these biology questions
-
Describe the three stages of memory and at least one psychological factor that might impair the accuracy of memory in each stage
-
(a) Identify three income statement accounts that are related to receivables. (b) Indicate where each account would be reported on the income statement.
-
Following are 45 terms or devices that are related to computer networking. Define all of them and give an explanation and or image of each. 1. Router 2. B-router 3. TCP/IP 4. PBX 5. Hub 6. Switch 7....
-
Suggest a systematic process that Daimler could have followed to increase the likelihood of merger success. Provide examples on how Daimler might have made such a process succeed.
-
Temporary Differences, Deferred Tax Liabilities. Meyer- Swift Construction Equipment Manufacturers engaged in an installment sale with one of its major customers. The firm negotiated the terms of the...
-
Identify the types of instruments and positions that event- driven managers most commonly trade.
-
How can computers be used to assist in the litigation process?
-
Larsen Corp. manufactures car seats in its Sarnia plant. Each car seat passes through the Assembly department and the Testing department. This problem focuses on the Assembly department. The...
-
Develop and write a 4 to 6-page, APA-formatted paper that a) compares and b) contrasts the leadership styles and scope of influence of two (2) historical figures. Remember, this is to be a...
-
In a random sample of 1800 observed values from the interval (0, 1), it was found that 391 values were between 0 and 0.2, 490 values were between 0.2 and 0.5, 580 values were between 0.5 and 0.8, and...
-
Part B: Problem Set - Vertical FDI (65 points total): Consider two firms. The first firm is based in Slovenia and produces ball bearings (upstream firm). The cost of producing ball bearings is 6 per...
-
Blossom Company's standard labor cost of producing one unit of Product DD is 3.80 hours at the rate of $10.30 per hour. During August, 40,200 hours of labor are incurred at a cost of $10.50 per hour...
-
Should humans prepare for a job market inundated with AI? Will some humans lose their current jobs? Will some opportunities be created? Will humans learn to adapt just as they have in the past with...
-
Ramirez Company installs a computerized manufacturing machine in its factory at the beginning of the year at a cost of $48,400. The machine's useful life is estimated at 10 years, or 394,000 units of...
-
Consider the following relation and by inspecting the types of dependencies, remove any redundant and inconsistent data. (10 Marks) Visit Date no Patient Age id PAtient cit Doc id Doc specialty...
-
If an investment I made grew from $3,500 to $20,000 in ten years, what effective rate did I earn?
-
Great Adventures Continuing General Ledger Case (This is a continuation of the Great Adventures problem from earlier chapters.) RWP7-11 Tony and Suzie see the need for a rugged all-terrain vehicle to...
-
What are some of the features of the Unified Process (UP)?
-
Use MATLABs LTI Viewer with the Nichols plot to find the gain margin, phase margin, zero dB frequency, and 180 frequency for a unity feedback system with the forward-path transfer function 5(s+ 6)...
-
For the unity feedback system shown in Figure P8.3, where do the following: a. Sketch the root locus. b. Find the asymptotes. c. Find the range of gain, K, that makes the system stable. d. Find the...
-
Given the system shown in Figure P7.24, find the sensitivity of the steady-state error to parameter a. Assume a step input. Plot the sensitivity as a function of parameter a. R(s) + K Cls) s(s + 2)(s...
-
(a) Describe the effect of temperature on the equilibrium constant. (b) Industrial \(\mathrm{CH}_{3} \mathrm{OH}\) is prepared according to the reaction \[ \mathrm{CO}(\mathrm{g})+2...
-
Mention the areas of application of the fuel cell.
-
Estimate the standard free energy change and equilibrium constant at \(700 \mathrm{~K}\) for the reaction \[ \mathrm{N}_{2}(\mathrm{~g})+3 \mathrm{H}_{2}(\mathrm{~g})=2 \mathrm{NH}_{3}(\mathrm{~g})...

Study smarter with the SolutionInn App