

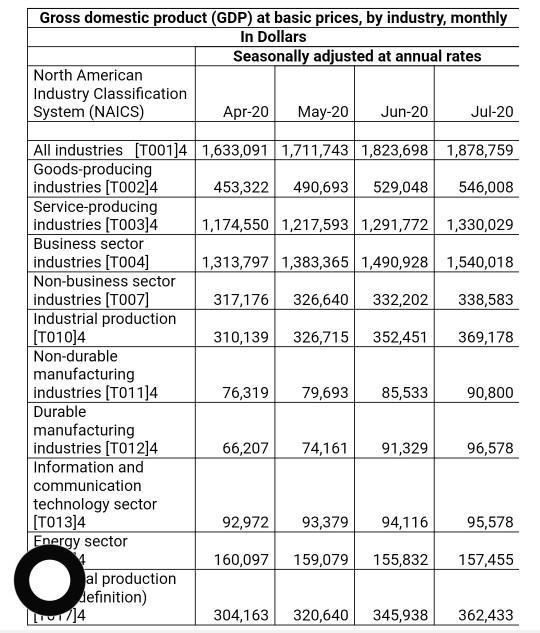
Following is the data of Gross domestic product (GDP) at basic prices, by industry, monthly different...
Fantastic news! We've Found the answer you've been seeking!
Question:
Expert Answer:
Frequency Distribution The data provided can be represented in the form of frequency distribution by using appropriate intervals The intervals used are 0500 5001000 10001500 15002000 dollars IntervalF... View the full answer

Related Book For 

Mathematical Applications for the Management Life and Social Sciences
ISBN: 978-1305108042
11th edition
Authors: Ronald J. Harshbarger, James J. Reynolds
Posted Date:
