

For the conditional probability of left-right by gender in Switzerland, we initially recoded Irscale so that...
Fantastic news! We've Found the answer you've been seeking!
Question:

Transcribed Image Text:
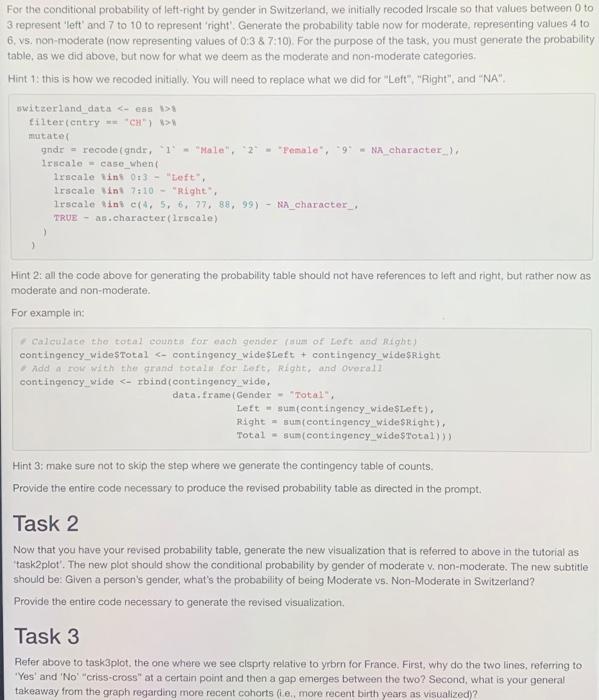
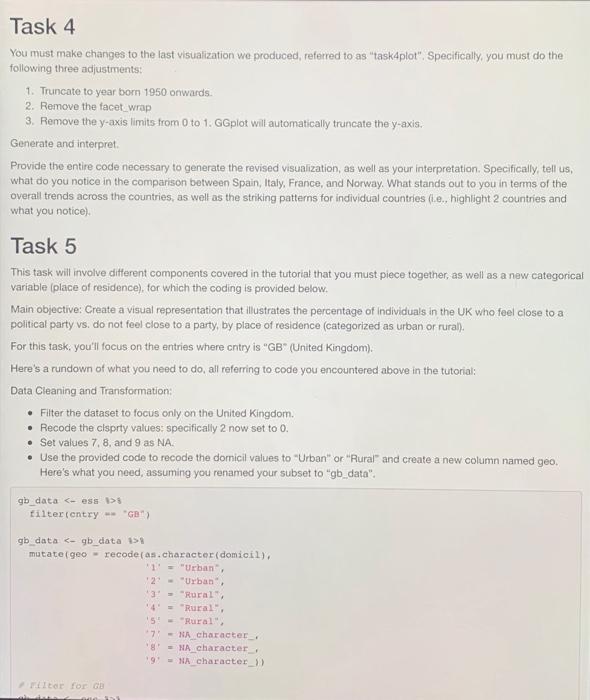
For the conditional probability of left-right by gender in Switzerland, we initially recoded Irscale so that values between 0 to 3 represent 'left' and 7 to 10 to represent 'right'. Generate the probability table now for moderate, representing values 4 to 6, vs. non-moderate (now representing values of 0:3 & 7:10). For the purpose of the task, you must generate the probability table, as we did above, but now for what we deem as the moderate and non-moderate categories. Hint 1: this is how we recoded initially. You will need to replace what we did for "Left", "Right", and "NA". switzerland_data 1 filter (cntry == "CH") > mutate( gndr = recode (gndr, "1 "Male", - "Female", "9" NA character_), 1rscale case_when ( 1rscale ins 0:3 "Left", irscale sint 7:10 "Right", Irscale sint c(4, 5, 6, 77, 88, 99) - NA character, TRUE as.character (1rscale) Hint 2: all the code above for generating the probability table should not have references to left and right, but rather now as moderate and non-moderate. For example in: Calculate the total counts for each gender (sum of Left and Right) contingency wideSTotal Task 4 You must make changes to the last visualization we produced, referred to as "task4plot". Specifically, you must do the following three adjustments: 1. Truncate to year born 1950 onwards. 2. Remove the facet wrap 3. Remove the y-axis limits from 0 to 1. GGplot will automatically truncate the y-axis. Generate and interpret. Provide the entire code necessary to generate the revised visualization, as well as your interpretation. Specifically, tell us, what do you notice in the comparison between Spain, Italy, France, and Norway. What stands out to you in terms of the overall trends across the countries, as well as the striking patterns for individual countries (i.e., highlight 2 countries and what you notice). Task 5 This task will involve different components covered in the tutorial that you must piece together, as well as a new categorical variable (place of residence), for which the coding is provided below. Main objective: Create a visual representation that illustrates the percentage of individuals in the UK who feel close to a political party vs. do not feel close to a party, by place of residence (categorized as urban or rural). For this task, you'll focus on the entries where cntry is "GB" (United Kingdom). Here's a rundown of what you need to do, all referring to code you encountered above in the tutorial: Data Cleaning and Transformation: Filter the dataset to focus only on the United Kingdom. Recode the clsprty values: specifically 2 now set to 0. Set values 7, 8, and 9 as NA. Use the provided code to recode the domicil values to "Urban" or "Rural" and create a new column named geo. Here's what you need, assuming you renamed your subset to "gb_data". gb_data filter (entry "GB") gb_data mutate (geo recode(as.character (domicil), '1' "Urban", Filter for GB 000121 2 "Urban". 3 "Rural", '4" "Rural", 155 "Rural", 7) -NA character_ '8" =NA character, 19" NA character_)) Set values 7, 8, and 9 as NA. Use the provided code to recode the domicil values to "Urban" or "Rural" and create a new column named geo. Here's what you need, assuming you renamed your subset to "gb_data". gb_data 1 filter (entry== "GB") gb_data mutate (geo recode (as.character (domicil), 1 = "Urban", *2= "Urban", 3- "Rural", "Rural", "Rural", 4 '5 "7" -NA character "8" 19 Pilter for CB gb_data 1 filter(entry "GB") ww NA character, NA character_)) Recode claprty and introduce the geo variable gb_data mutate (claprty recode(clsprty, 20, "7" - NA_real_ NA_real_. 8 -9 NA_real_), geo recode (as.character (domicil), 'I' "Urban", 2 "Urban" 3 "Rural") A "Rural", '5' - "Rural", "7" NA character. 8 NA character, -NA character_)) Compute the proportions of 'Yes' responses for feeling close to a party, based on urban-rural residence. Data Visualization: Convert your computed proportions dataframe from wide format to long format, akin to the prob_long example. Construct a ggplot visualization. Ensure: The x-axis displays the proportions as percentages. Multiply by 100. The y-axis should capture the response, with labels as "Yes" for 1 and "No" for 0. Fill color to represent the response. Use faceting to create separate plots for "Urban" and "Rural" residence, with nrow = 1. Update all labels and titles. Your title should be "Percentage Distribution of Party Closeness in the UK", with a subtitle of "by place of residence: Urban vs. Rural". For the conditional probability of left-right by gender in Switzerland, we initially recoded Irscale so that values between 0 to 3 represent 'left' and 7 to 10 to represent 'right'. Generate the probability table now for moderate, representing values 4 to 6, vs. non-moderate (now representing values of 0:3 & 7:10). For the purpose of the task, you must generate the probability table, as we did above, but now for what we deem as the moderate and non-moderate categories. Hint 1: this is how we recoded initially. You will need to replace what we did for "Left", "Right", and "NA". switzerland_data 1 filter (cntry == "CH") > mutate( gndr = recode (gndr, "1 "Male", - "Female", "9" NA character_), 1rscale case_when ( 1rscale ins 0:3 "Left", irscale sint 7:10 "Right", Irscale sint c(4, 5, 6, 77, 88, 99) - NA character, TRUE as.character (1rscale) Hint 2: all the code above for generating the probability table should not have references to left and right, but rather now as moderate and non-moderate. For example in: Calculate the total counts for each gender (sum of Left and Right) contingency wideSTotal Task 4 You must make changes to the last visualization we produced, referred to as "task4plot". Specifically, you must do the following three adjustments: 1. Truncate to year born 1950 onwards. 2. Remove the facet wrap 3. Remove the y-axis limits from 0 to 1. GGplot will automatically truncate the y-axis. Generate and interpret. Provide the entire code necessary to generate the revised visualization, as well as your interpretation. Specifically, tell us, what do you notice in the comparison between Spain, Italy, France, and Norway. What stands out to you in terms of the overall trends across the countries, as well as the striking patterns for individual countries (i.e., highlight 2 countries and what you notice). Task 5 This task will involve different components covered in the tutorial that you must piece together, as well as a new categorical variable (place of residence), for which the coding is provided below. Main objective: Create a visual representation that illustrates the percentage of individuals in the UK who feel close to a political party vs. do not feel close to a party, by place of residence (categorized as urban or rural). For this task, you'll focus on the entries where cntry is "GB" (United Kingdom). Here's a rundown of what you need to do, all referring to code you encountered above in the tutorial: Data Cleaning and Transformation: Filter the dataset to focus only on the United Kingdom. Recode the clsprty values: specifically 2 now set to 0. Set values 7, 8, and 9 as NA. Use the provided code to recode the domicil values to "Urban" or "Rural" and create a new column named geo. Here's what you need, assuming you renamed your subset to "gb_data". gb_data filter (entry "GB") gb_data mutate (geo recode(as.character (domicil), '1' "Urban", Filter for GB 000121 2 "Urban". 3 "Rural", '4" "Rural", 155 "Rural", 7) -NA character_ '8" =NA character, 19" NA character_)) Set values 7, 8, and 9 as NA. Use the provided code to recode the domicil values to "Urban" or "Rural" and create a new column named geo. Here's what you need, assuming you renamed your subset to "gb_data". gb_data 1 filter (entry== "GB") gb_data mutate (geo recode (as.character (domicil), 1 = "Urban", *2= "Urban", 3- "Rural", "Rural", "Rural", 4 '5 "7" -NA character "8" 19 Pilter for CB gb_data 1 filter(entry "GB") ww NA character, NA character_)) Recode claprty and introduce the geo variable gb_data mutate (claprty recode(clsprty, 20, "7" - NA_real_ NA_real_. 8 -9 NA_real_), geo recode (as.character (domicil), 'I' "Urban", 2 "Urban" 3 "Rural") A "Rural", '5' - "Rural", "7" NA character. 8 NA character, -NA character_)) Compute the proportions of 'Yes' responses for feeling close to a party, based on urban-rural residence. Data Visualization: Convert your computed proportions dataframe from wide format to long format, akin to the prob_long example. Construct a ggplot visualization. Ensure: The x-axis displays the proportions as percentages. Multiply by 100. The y-axis should capture the response, with labels as "Yes" for 1 and "No" for 0. Fill color to represent the response. Use faceting to create separate plots for "Urban" and "Rural" residence, with nrow = 1. Update all labels and titles. Your title should be "Percentage Distribution of Party Closeness in the UK", with a subtitle of "by place of residence: Urban vs. Rural".
Expert Answer:
Answer rating: 100% (QA)
The skin friction coefficient Cf for a laminar boundary ... View the full answer

Related Book For 

Statistics Informed Decisions Using Data
ISBN: 9780134133539
5th Edition
Authors: Michael Sullivan III
Posted Date:
Students also viewed these programming questions
-
Writea 950-word paper in which you analyze Albert Bandura cognitive theories. Address the following items: Discuss the contributions that Albert Banduramade to the field of learning and cognition....
-
Explain the cash flow matching approach to portfolio management. Explain the key issues with using a cash flow matching portfolio management approach. Identify and explain some alternative approaches...
-
Planning is one of the most important management functions in any business. A front office managers first step in planning should involve determine the departments goals. Planning also includes...
-
What is the first question to ask when redefining quality goals? What is the purpose of what I am trying to accomplish? What is the right purpose for me to be working on? What quality goals should I...
-
Why does a heavy parachutist fall faster than a lighter parachutist who wears a parachute of the same size?
-
Like most central banks around the world, the Federal Reserve currently does not provide deposit accounts for individuals. Suppose the Fed decided to issue digital currency by offering unlimited...
-
Rewrite \(\frac{48}{13}\) as a mixed number.
-
Zurich Company reports pretax financial income of $70,000 for 2008. The following items cause taxable income to be different than pretax financial income. 1. Depreciation on the tax return is greater...
-
LePage Manufacturing Ltd. agrees to lease machinery toMorand...LePage Manufacturing Ltd. agrees to lease machinery to MorandCorporation on July 15, 2020. Both companies report underASPE. The follo 0...
-
Kevin has met with you and Brenda. Brenda has explained his current duties as an enduring power of attorney holder. She has also provided Kevin with a copy of Norman's will and briefly explained his...
-
Use the method of disks/rings to determine the volume of the solid obtained by rotating the region bounded by x = y - 6y + 10 and x = 5 about the y-axis Shell 4. Rotate the region bounded byx =...
-
Selecting one private bank and one government bank in the PHilippines.(BPI AND LAND BANK) Then, comparing and contrasting (similarities and differences) its vision, mission, goals, objectives,...
-
An 100.0-kg dresser is pushed up a 35.0 ramp with an applied force of 1000. N. The coefficient of friction is 0.250. What is the acceleration of the dresser
-
Following is the adjusted trial balance, with accounts in alphabetical order, for TRN Magazine as at January 3 1 , 2 0 2 3 : Debit Credit Accounts receivable $ 2 1 , 4 0 0 Accumulated depreciation,...
-
A sling shot is made by attaching a large metal weight (10.0 kg) to a string with a length of 1.50 m. The sling shot is swung around with a angular velocity of 38.0 rad/s. Another sling shot is made...
-
A stock price is currently $48. Over each of the next two three-month periods it is expected to go up by 6% or down by 5%. The risk-free interest rate is 3% per annum with semi-annual compounding. 1....
-
Earnings per share (EPS) for Valcor Inc. are $3 at a sales level of $3 million. If Valcor's degree of operating leverage is 1.5 and its degree of combined leverage is 3.0, what will happen to EPS if...
-
Currently, there are five concepts of food stands, including: hot dogs, soft pretzels, turkey legs, sandwich wraps, and funnel cakes. This approach will double the existing number of food stands...
-
To test H0: = 35 versus H1: 35, a random sample of size n = 15 is obtained from a population that is known to be normally distributed. (a) If the sample standard deviation is determined to be s =...
-
What is the mean square due to treatment estimate of 2? What is the mean square due to error estimate of 2?
-
The manufacturer of processed deli meats reports that the standard deviation of the number of carbohydrates in its smoked turkey breast is 0.5 gram per 2-ounce serving. A dietitian does not believe...
-
A symmetric matrix is one for which the transpose of the matrix is the same as the original matrix, \(A^{T}=A\). An antisymmetric matrix is one that satisfies \(A^{T}=-A\). a. Show that the diagonal...
-
Consider the matrix representations for two-dimensional rotations of vectors by angles \(\alpha\) and \(\beta\), denoted by \(R_{\alpha}\) and \(R_{\beta}\), respectively. a. Find \(R_{\alpha}^{-1}\)...
-
Consider the matrix \[A=\left(\begin{array}{ccc} \frac{1}{2} & \frac{1}{\sqrt{2}} & \frac{1}{2} \\ -\frac{1}{\sqrt{2}} & 0 & \frac{1}{\sqrt{2}} \\ \frac{1}{2} & -\frac{1}{\sqrt{2}} & \frac{1}{2}...

Study smarter with the SolutionInn App