

Forecast Ideko's free cash flow (reproduce Table 19.10 assuming Ideko's market share will increase by 0.45...
Fantastic news! We've Found the answer you've been seeking!
Question:
Transcribed Image Text:
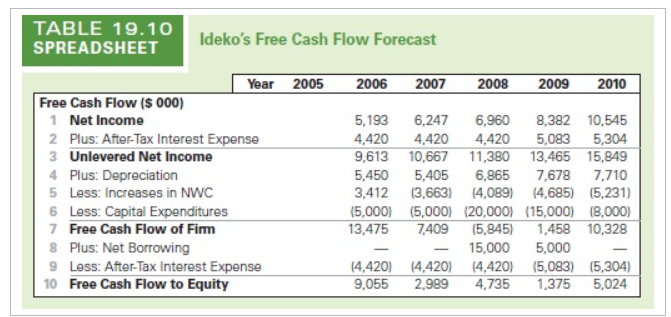
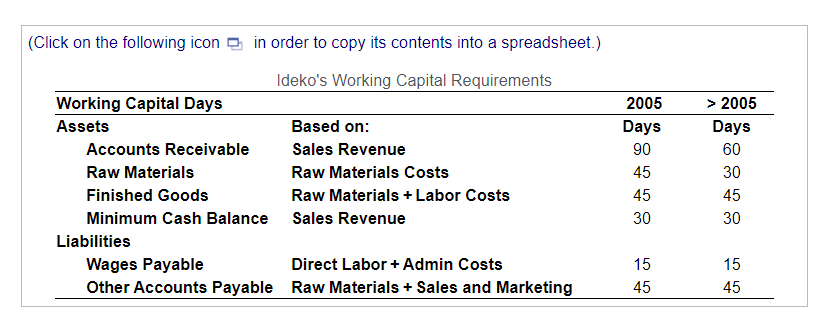
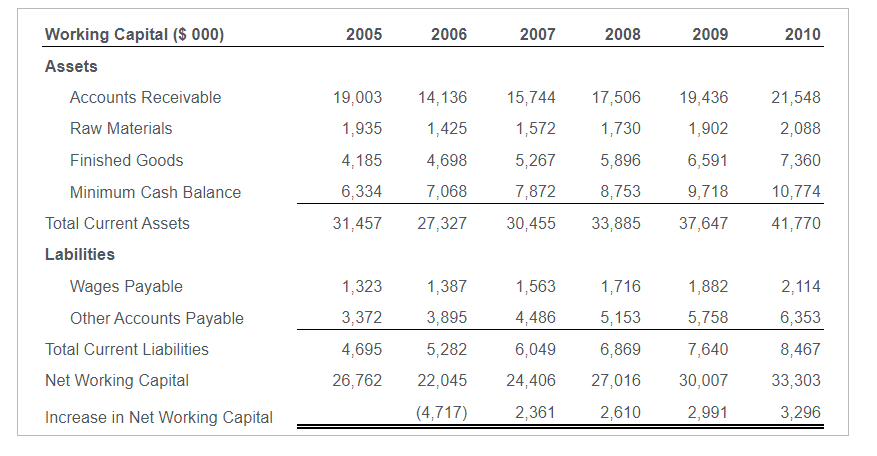
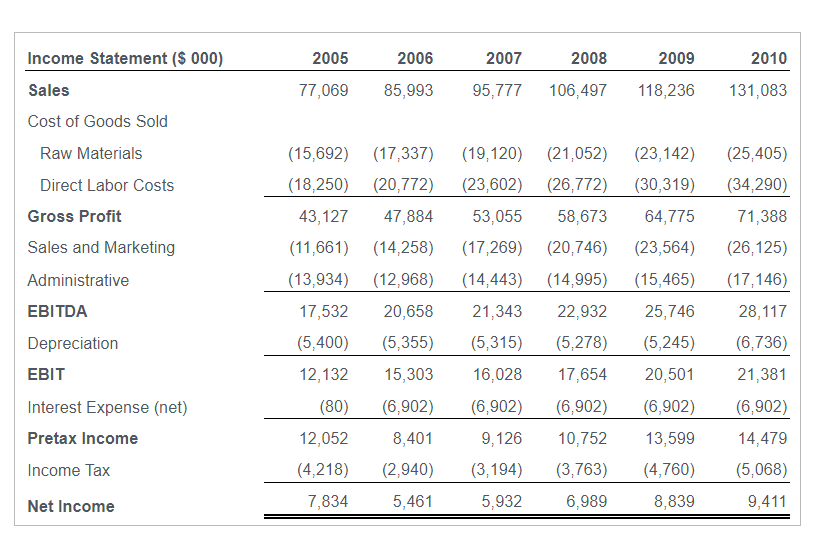
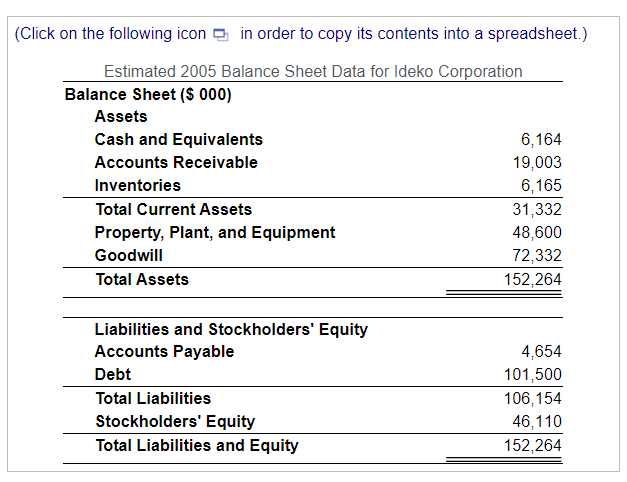
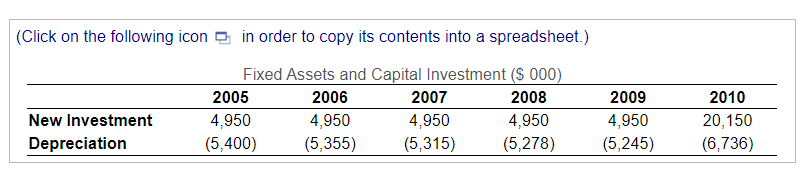
Forecast Ideko's free cash flow (reproduce Table 19.10 assuming Ideko's market share will increase by 0.45 percent per year; investment, financing, and depreciation will be adjusted accordingly; and the projected improvements in working capital occur (that is, ldeko's working capital requirements through 2010 will be as shown here). Ideko's pro-forma income statements for 2005-2010 are shown here, while its balance sheet for 2005 is shown here. Ideko's production plant will require an expansion in 2010 (when production volume will exceed the current level by 50%), and the cost of this expansion will be $15.2 million. This amount will be borrowed from a financial institution at an interest rate of 6.8%. The new projected capital investments are shown here. (Assume an income tax rate of 35%.) Calculate Ideko's free cash flow through 2010 below: (Round to the nearest $ 000.) Free Cash Flow ($ 000) Net Income Plus: After-tax Interest Expense Unlevered Net Income Plus: Depreciation Less: Increase in NWC Less: Capital Expenditures Free Cash Flow of Firm Plus: Net Borrowing Less: After-tax Interest Expense Free Cash Flow to Equity 2006 TABLE 19.10 SPREADSHEET Ideko's Free Cash Flow Forecast Year 2005 Free Cash Flow ($ 000) 1 Net Income 2 Plus: After-Tax Interest Expense 3 Unlevered Net Income 4 Plus: Depreciation 5 Less: Increases in NWC 6 Less: Capital Expenditures 7 Free Cash Flow of Fir 8 Plus: Net Borrowing 9 Less: After-Tax Interest Expense 10 Free Cash Flow to Equity 2006 2007 2008 (4,420) (4,420) 9,055 2009 5,193 6,247 8,382 10,545 5,304 6,960 4,420 4,420 4,420 5,083 9,613 10,667 11,380 5,405 (3,663) (4,089) (4,685) (5,231) 13,465 15,849 6,865 7,678 7,710 5,450 3,412 (5,000) (5,000) (20,000) (15,000) (8,000) 13,475 7,409 (5,845) 1,458 10,328 15,000 5,000 (5,083) (5,304) 1,375 5,024 (4,420) 2,989 4,735 2010 (Click on the following icon in order to copy its contents into a spreadsheet.) Ideko's Working Capital Requirements Working Capital Days Assets Accounts Receivable Raw Materials Finished Goods Minimum Cash Balance Liabilities Based on: Sales Revenue Raw Materials Costs Raw Materials + Labor Costs Sales Revenue Wages Payable Direct Labor + Admin Costs Other Accounts Payable Raw Materials + Sales and Marketing 2005 Days 90 45 45 30 15 45 > 2005 Days 60 30 45 30 15 45 Working Capital ($ 000) Assets Accounts Receivable Raw Materials Finished Goods Minimum Cash Balance Total Current Assets Labilities Wages Payable Other Accounts Payable Total Current Liabilities Net Working Capital Increase in Net Working Capital 2005 2006 19,003 14,136 1,935 1,425 4,185 4,698 6,334 7,068 31,457 27,327 1,323 3,372 4,695 26,762 2007 2008 2009 15,744 17,506 19,436 1,572 1,730 1,902 5,267 5,896 6,591 7,872 8,753 9,718 30,455 33,885 37,647 1,387 1,563 1,716 1,882 3,895 4,486 5,153 5,758 5,282 6,049 6,869 7,640 22,045 24,406 27,016 30,007 (4,717) 2,361 2,610 2,991 2010 21,548 2,088 7,360 10,774 41,770 2,114 6,353 8,467 33,303 3,296 Income Statement ($ 000) Sales Cost of Goods Sold Raw Materials Direct Labor Costs Gross Profit Sales and Marketing Administrative EBITDA Depreciation EBIT Interest Expense (net) Pretax Income Income Tax Net Income 2005 2006 2007 2008 77,069 85,993 95,777 106,497 2009 118,236 131,083 2010 (15,692) (17,337) (19,120) (21,052) (23,142) (18,250) (20,772) (23,602) (26,772) (30,319) 43,127 47,884 53,055 58,673 64,775 (11,661) (14,258) (17,269) (20,746) (23,564) (13,934) (12,968) (14,443) (14,995) (15,465) 17,532 20,658 21,343 22,932 25,746 (5,400) (5,355) (5,315) (5,278) (5,245) 12,132 15,303 16,028 17,654 20,501 (80) (6,902) (6,902) (6,902) (6,902) 12,052 8,401 9,126 10,752 13,599 (4,218) (2,940) (3,194) (3,763) (4,760) 7,834 5,461 5,932 6,989 8,839 (25,405) (34,290) 71,388 (26,125) (17,146) 28,117 (6,736) 21,381 (6,902) 14,479 (5,068) 9,411 (Click on the following icon in order to copy its contents into a spreadsheet.) Estimated 2005 Balance Sheet Data for Ideko Corporation Balance Sheet ($ 000) Assets Cash and Equivalents Accounts Receivable Inventories Total Current Assets Property, Plant, and Equipment Goodwill Total Assets Liabilities and Stockholders' Equity Accounts Payable Debt Total Liabilities Stockholders' Equity Total Liabilities and Equity 6,164 19,003 6,165 31,332 48,600 72,332 152,264 4,654 101,500 106,154 46,110 152,264 (Click on the following icon in order to copy its contents into a spreadsheet.) Fixed Assets and Capital Investment ($ 000) 2007 2008 4,950 4,950 (5,315) (5,278) New Investment Depreciation 2005 4,950 (5,400) 2006 4,950 (5,355) 2009 4,950 (5,245) 2010 20,150 (6,736) Forecast Ideko's free cash flow (reproduce Table 19.10 assuming Ideko's market share will increase by 0.45 percent per year; investment, financing, and depreciation will be adjusted accordingly; and the projected improvements in working capital occur (that is, ldeko's working capital requirements through 2010 will be as shown here). Ideko's pro-forma income statements for 2005-2010 are shown here, while its balance sheet for 2005 is shown here. Ideko's production plant will require an expansion in 2010 (when production volume will exceed the current level by 50%), and the cost of this expansion will be $15.2 million. This amount will be borrowed from a financial institution at an interest rate of 6.8%. The new projected capital investments are shown here. (Assume an income tax rate of 35%.) Calculate Ideko's free cash flow through 2010 below: (Round to the nearest $ 000.) Free Cash Flow ($ 000) Net Income Plus: After-tax Interest Expense Unlevered Net Income Plus: Depreciation Less: Increase in NWC Less: Capital Expenditures Free Cash Flow of Firm Plus: Net Borrowing Less: After-tax Interest Expense Free Cash Flow to Equity 2006 TABLE 19.10 SPREADSHEET Ideko's Free Cash Flow Forecast Year 2005 Free Cash Flow ($ 000) 1 Net Income 2 Plus: After-Tax Interest Expense 3 Unlevered Net Income 4 Plus: Depreciation 5 Less: Increases in NWC 6 Less: Capital Expenditures 7 Free Cash Flow of Fir 8 Plus: Net Borrowing 9 Less: After-Tax Interest Expense 10 Free Cash Flow to Equity 2006 2007 2008 (4,420) (4,420) 9,055 2009 5,193 6,247 8,382 10,545 5,304 6,960 4,420 4,420 4,420 5,083 9,613 10,667 11,380 5,405 (3,663) (4,089) (4,685) (5,231) 13,465 15,849 6,865 7,678 7,710 5,450 3,412 (5,000) (5,000) (20,000) (15,000) (8,000) 13,475 7,409 (5,845) 1,458 10,328 15,000 5,000 (5,083) (5,304) 1,375 5,024 (4,420) 2,989 4,735 2010 (Click on the following icon in order to copy its contents into a spreadsheet.) Ideko's Working Capital Requirements Working Capital Days Assets Accounts Receivable Raw Materials Finished Goods Minimum Cash Balance Liabilities Based on: Sales Revenue Raw Materials Costs Raw Materials + Labor Costs Sales Revenue Wages Payable Direct Labor + Admin Costs Other Accounts Payable Raw Materials + Sales and Marketing 2005 Days 90 45 45 30 15 45 > 2005 Days 60 30 45 30 15 45 Working Capital ($ 000) Assets Accounts Receivable Raw Materials Finished Goods Minimum Cash Balance Total Current Assets Labilities Wages Payable Other Accounts Payable Total Current Liabilities Net Working Capital Increase in Net Working Capital 2005 2006 19,003 14,136 1,935 1,425 4,185 4,698 6,334 7,068 31,457 27,327 1,323 3,372 4,695 26,762 2007 2008 2009 15,744 17,506 19,436 1,572 1,730 1,902 5,267 5,896 6,591 7,872 8,753 9,718 30,455 33,885 37,647 1,387 1,563 1,716 1,882 3,895 4,486 5,153 5,758 5,282 6,049 6,869 7,640 22,045 24,406 27,016 30,007 (4,717) 2,361 2,610 2,991 2010 21,548 2,088 7,360 10,774 41,770 2,114 6,353 8,467 33,303 3,296 Income Statement ($ 000) Sales Cost of Goods Sold Raw Materials Direct Labor Costs Gross Profit Sales and Marketing Administrative EBITDA Depreciation EBIT Interest Expense (net) Pretax Income Income Tax Net Income 2005 2006 2007 2008 77,069 85,993 95,777 106,497 2009 118,236 131,083 2010 (15,692) (17,337) (19,120) (21,052) (23,142) (18,250) (20,772) (23,602) (26,772) (30,319) 43,127 47,884 53,055 58,673 64,775 (11,661) (14,258) (17,269) (20,746) (23,564) (13,934) (12,968) (14,443) (14,995) (15,465) 17,532 20,658 21,343 22,932 25,746 (5,400) (5,355) (5,315) (5,278) (5,245) 12,132 15,303 16,028 17,654 20,501 (80) (6,902) (6,902) (6,902) (6,902) 12,052 8,401 9,126 10,752 13,599 (4,218) (2,940) (3,194) (3,763) (4,760) 7,834 5,461 5,932 6,989 8,839 (25,405) (34,290) 71,388 (26,125) (17,146) 28,117 (6,736) 21,381 (6,902) 14,479 (5,068) 9,411 (Click on the following icon in order to copy its contents into a spreadsheet.) Estimated 2005 Balance Sheet Data for Ideko Corporation Balance Sheet ($ 000) Assets Cash and Equivalents Accounts Receivable Inventories Total Current Assets Property, Plant, and Equipment Goodwill Total Assets Liabilities and Stockholders' Equity Accounts Payable Debt Total Liabilities Stockholders' Equity Total Liabilities and Equity 6,164 19,003 6,165 31,332 48,600 72,332 152,264 4,654 101,500 106,154 46,110 152,264 (Click on the following icon in order to copy its contents into a spreadsheet.) Fixed Assets and Capital Investment ($ 000) 2007 2008 4,950 4,950 (5,315) (5,278) New Investment Depreciation 2005 4,950 (5,400) 2006 4,950 (5,355) 2009 4,950 (5,245) 2010 20,150 (6,736)
Expert Answer:
Answer rating: 100% (QA)
To calculate Idekos free cash flow through 2010 we need to consider various factors such as net income aftertax interest expense depreciation changes ... View the full answer

Related Book For 
Fundamentals Of Corporate Finance
ISBN: 9780135811603
5th Edition
Authors: Jonathan Berk, Peter DeMarzo, Jarrad Harford
Posted Date:
Students also viewed these finance questions
-
Reproduce Idekos balance sheet and statement of cash flows, assuming Idekos market share will increase by 0.5% per year; investment, financing, and depreciation will be adjusted accordingly; and the...
-
At the beginning of the last quarter of 2011, Youngston, Inc., a consumer products firm, hired Maria Carrillo to take over one of its divisions. The division manufactured small home appliances and...
-
Write a program that plots average path length versus the number of random edges as random shortcuts are added to a 2-ring graph on 1,000 vertices.
-
Assuming the same information for Problem 25-2, suppose Hastings will increase Vandells level of debt after Year 3 so that the target capital structure is now 45 percent debt. Assume that with this...
-
Summarize the social factors that govern consumer access to the Internet. How can companies overcome these influences once people venture online?
-
Patty Hayes owned four Personal Seat Licenses (PSLs) at the Cleveland Browns Stadium. Hayess PSLs reserved four seats on the 50-yard line, at the railing, on the north side of the stadium. As the...
-
The Chickn-Pickn fast-food chain is considering how to expand its operations. Three types of retail outlets are possible: a lunch counter operation designed for office buildings in downtown areas, an...
-
A 47-kg pole vaulter running at 10 m/s vaults over the bar. Her speed when she is above the bar is 1.5 m/s. Neglect air resistance, as well as any energy absorbed by the pole, and determine her...
-
In a July 2018 Gallup poll that surveyed 1,033 randomly selected U.S. adults, 5% said that they considered themselves vegetarians. a. Describe what the parameter is in this context. b. The standard...
-
Novell, Inc., has the following mutually exclusive projects. Year Project A Project B 0 $22,000 23 $19,000 11,500 12,500 9,000 8,000 2,800 8,000 a-1. Calculate the payback period for each project....
-
Using Boolean algebraic identities, simplify the following Boolean expressions to minimum number literals: a. A'BC' + BC'D' + A'CD + B'CD + A'BD b. (W + X +Y ') (W '+X '+Y+Z (W + X '+Y+Z) c. (a...
-
(a) Write a method in Java to sort a stack of n integer numbers, s, in increasing order. static Stack sort(Stack s) To implement this method you must use one more auxiliary stack and you should not...
-
For last year, Barrel Corp. reported the following: Item Amount Finished goods inventory-beginning $48,000 Finished goods inventory-ending 52,000 Work-in-process inventory-beginning 96,000...
-
10. What will be the value of i after the C statements below have been executed? i=3; j= 10; if ((3* i)
-
Find dy/dx by implicit differentiation. x Iny+y=xoy6
-
A condensed income statement for Trident Shipping and a partially completed vertical analysis are presented below. Required: 1. Complete the vertical analysis by computing each missing line item as a...
-
a. Show that the expansion of q(x) in ascending powers of x can be approximated to 10 2x + Bx 2 + Cx 3 where B and C are constants to be found. b. Find the percentage error made in using the series...
-
What is the price per $100 face value of a four-year, zero-coupon, risk-free bond? The current zero-coupon yield curve for risk-free bonds is as follows: Maturity (years) 1 YTM 5.00% 2 5.50% 3 5.75%...
-
Suppose that in 2019, Global launched an aggressive marketing campaign that boosted sales by 15%. However, their operating margin fell from 5.57% to 4.50%. Suppose that they had no other income,...
-
Nirvana Chip Designs has finished designing its next generation of chips, the XJ5000 series and is getting ready to start production. As the analyst on the project, you are required to prepare pro...
-
We can make a static measurement to deduce the spring constant to use in the model. If a \(61 \mathrm{~kg}\) woman stands on a low wall with her full weight on the ball of one foot and the heel free...
-
A \(1.00 \mathrm{~kg}\) block is attached to a horizontal spring with spring INT constant \(2500 \mathrm{~N} / \mathrm{m}\). The block is at rest on a frictionless surface. A \(10.0 \mathrm{~g}\)...
-
If, during a stride, the stretch causes her center of mass to lower by \(10 \mathrm{~mm}\), what is the stored energy? A. \(3.0 \mathrm{~J}\) B. \(6.0 \mathrm{~J}\) C. \(9.0 \mathrm{~J}\) D. \(12...

Study smarter with the SolutionInn App