

Forecasting the Income Statement, Balance Sheet, and Statement of Cash Flows The following are the financial...
Fantastic news! We've Found the answer you've been seeking!
Question:
Transcribed Image Text:
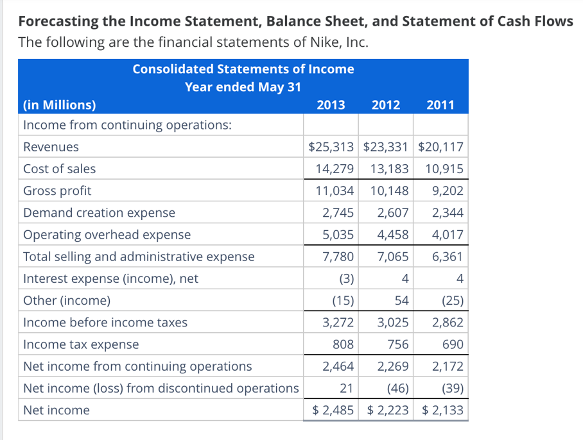
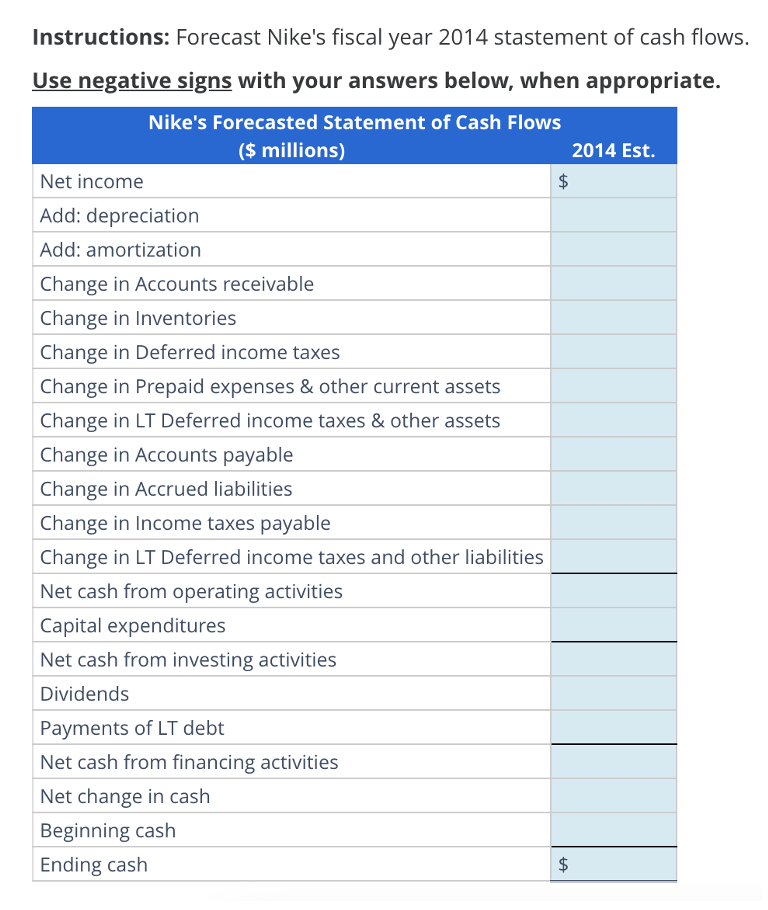
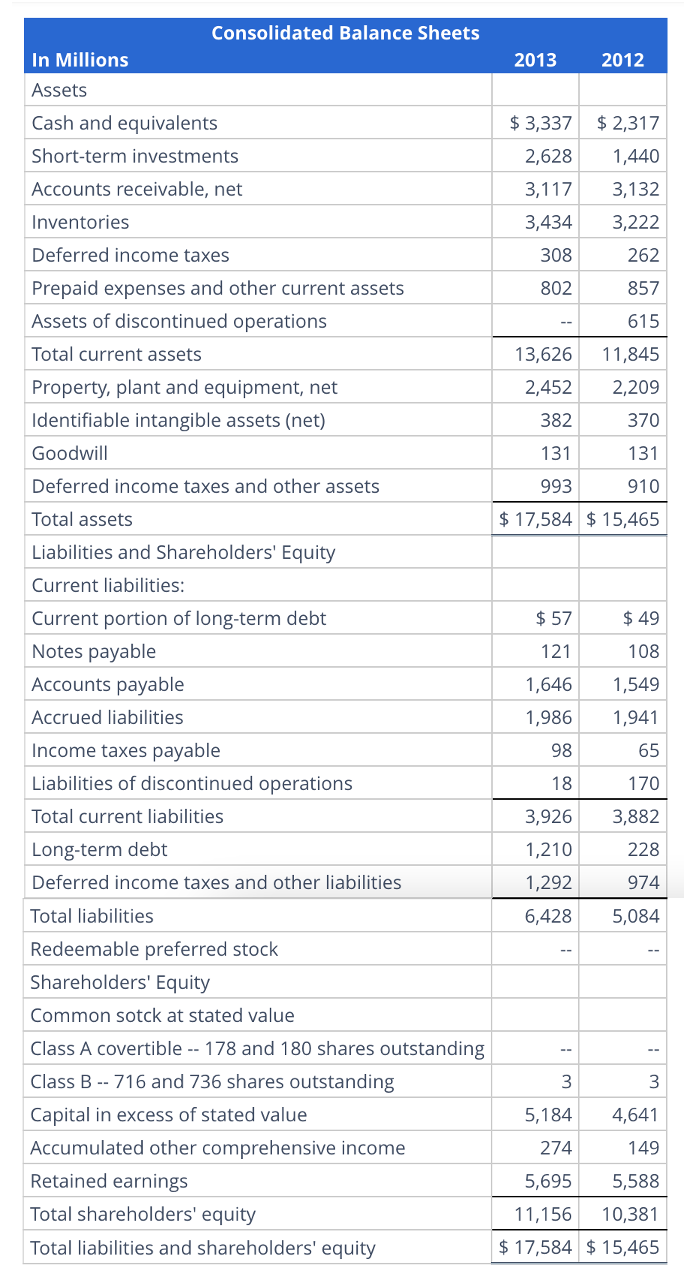
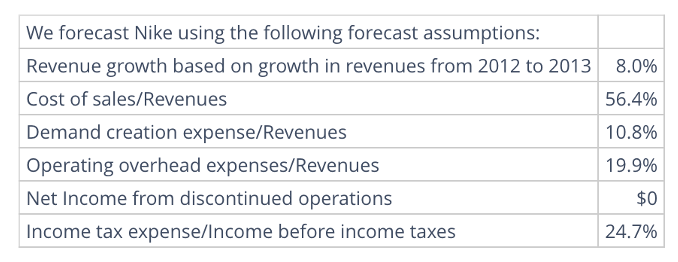
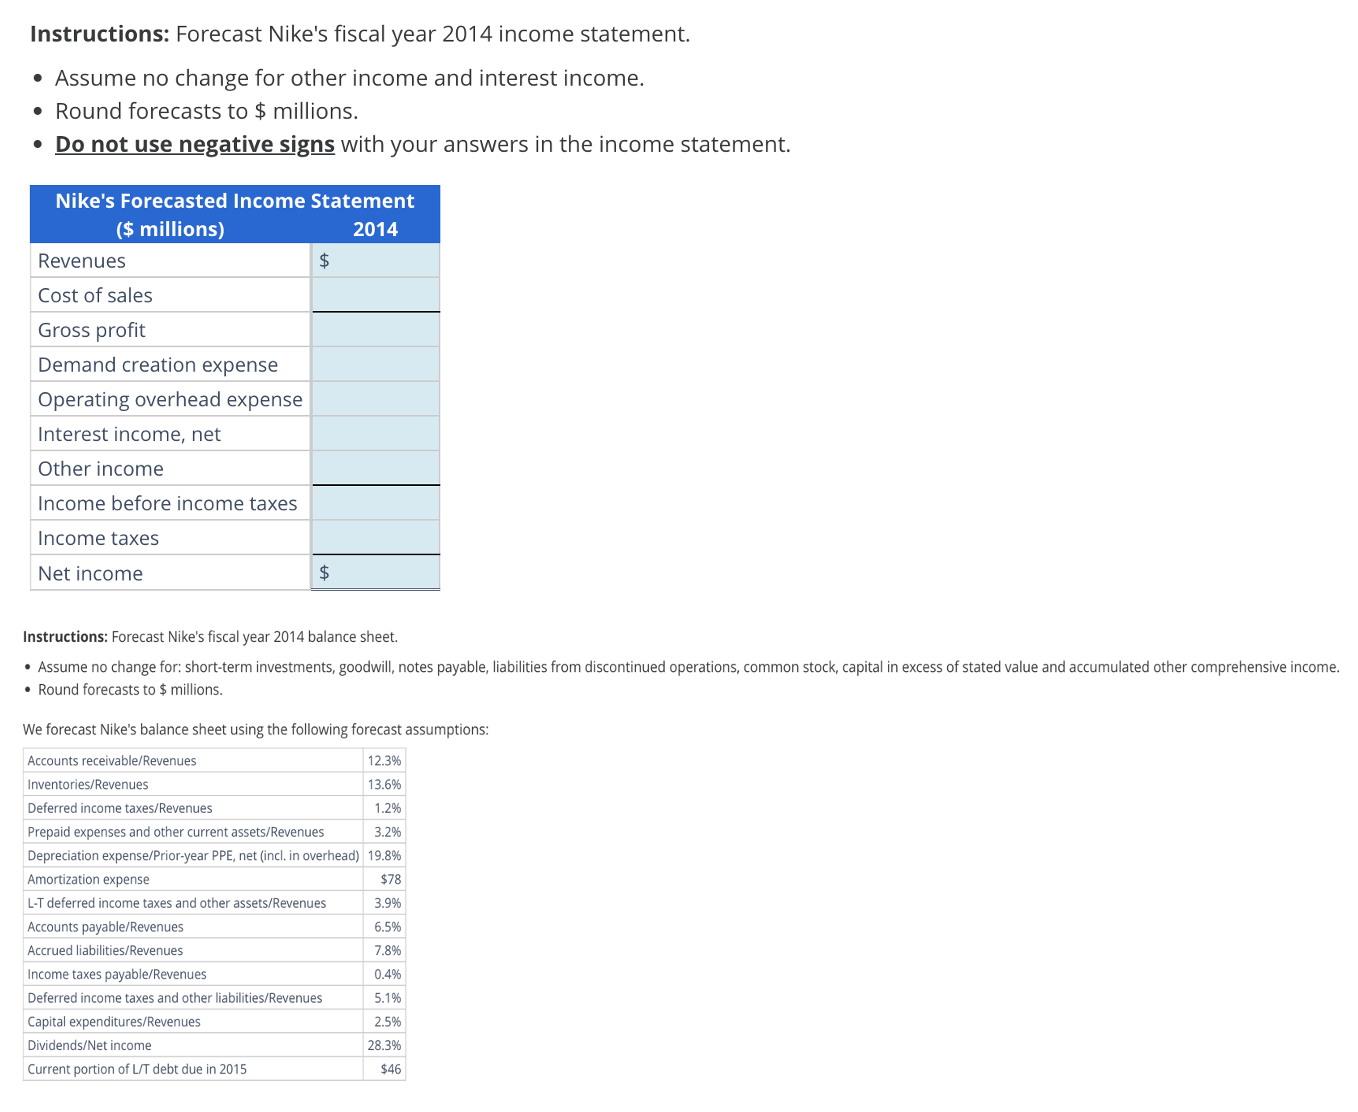
Forecasting the Income Statement, Balance Sheet, and Statement of Cash Flows The following are the financial statements of Nike, Inc. Consolidated Statements of Income Year ended May 31 (in Millions) 2013 2012 2011 Income from continuing operations: Revenues $25,313 $23,331 $20,117 Cost of sales 14,279 13,183 10,915 Gross profit 11,034 10,148 9,202 Demand creation expense 2,745 2,607 2,344 Operating overhead expense 5,035 4,458 4,017 Total selling and administrative expense 7,780 7,065 6,361 Interest expense (income), net (3) 4 4 Other (income) (15) 54 (25) Income before income taxes 3,272 3,025 2,862 Income tax expense 808 756 690 Net income from continuing operations 2,464 2,269 2,172 Net income (loss) from discontinued operations 21 (46) (39) Net income $2,485 $2,223 $2,133 Instructions: Forecast Nike's fiscal year 2014 stastement of cash flows. Use negative signs with your answers below, when appropriate. Nike's Forecasted Statement of Cash Flows Net income Add: depreciation Add: amortization ($ millions) 2014 Est. Change in Accounts receivable Change in Inventories Change in Deferred income taxes Change in Prepaid expenses & other current assets Change in LT Deferred income taxes & other assets Change in Accounts payable Change in Accrued liabilities Change in Income taxes payable Change in LT Deferred income taxes and other liabilities Net cash from operating activities Capital expenditures Net cash from investing activities Dividends Payments of LT debt Net cash from financing activities Net change in cash Beginning cash Ending cash +A In Millions Consolidated Balance Sheets 2013 2012 Assets Cash and equivalents $3,337 $2,317 Short-term investments 2,628 1,440 Accounts receivable, net 3,117 3,132 Inventories 3,434 3,222 Deferred income taxes 308 262 Prepaid expenses and other current assets 802 857 Assets of discontinued operations 615 Total current assets 13,626 11,845 Property, plant and equipment, net 2,452 2,209 Identifiable intangible assets (net) 382 370 Goodwill 131 131 993 910 Deferred income taxes and other assets Total assets Liabilities and Shareholders' Equity $ 17,584 $15,465 Current liabilities: Current portion of long-term debt $ 57 $ 49 Notes payable 121 108 Accounts payable 1,646 1,549 Accrued liabilities 1,986 1,941 Income taxes payable 98 65 Liabilities of discontinued operations 18 170 Total current liabilities 3,926 3,882 Long-term debt 1,210 228 Deferred income taxes and other liabilities 1,292 974 Total liabilities 6,428 5,084 Redeemable preferred stock Shareholders' Equity Common sotck at stated value Class A covertible 178 and 180 shares outstanding Class B-716 and 736 shares outstanding Capital in excess of stated value Accumulated other comprehensive income Retained earnings Total shareholders' equity Total liabilities and shareholders' equity 3 3 5,184 4,641 274 149 5,695 5,588 11,156 10,381 $ 17,584 $15,465 We forecast Nike using the following forecast assumptions: Revenue growth based on growth in revenues from 2012 to 2013 8.0% Cost of sales/Revenues 56.4% Demand creation expense/Revenues 10.8% Operating overhead expenses/Revenues 19.9% Net Income from discontinued operations $0 Income tax expense/Income before income taxes 24.7% Instructions: Forecast Nike's fiscal year 2014 income statement. • Assume no change for other income and interest income. • Round forecasts to $ millions. • Do not use negative signs with your answers in the income statement. Nike's Forecasted Income Statement ($ millions) Revenues Cost of sales Gross profit Demand creation expense Operating overhead expense Interest income, net Other income Income before income taxes Income taxes Net income 2014 $ $ Instructions: Forecast Nike's fiscal year 2014 balance sheet. • Assume no change for: short-term investments, goodwill, notes payable, liabilities from discontinued operations, common stock, capital in excess of stated value and accumulated other comprehensive income. • Round forecasts to $ millions. We forecast Nike's balance sheet using the following forecast assumptions: Accounts receivable/Revenues Inventories/Revenues 12.3% 13.6% Deferred income taxes/Revenues 1.2% Prepaid expenses and other current assets/Revenues 3.2% Depreciation expense/Prior-year PPE, net (incl. in overhead) 19.8% Amortization expense $78 L-T deferred income taxes and other assets/Revenues 3.9% Accounts payable/Revenues 6.5% Accrued liabilities/Revenues 7.8% Income taxes payable/Revenues 0.4% Deferred income taxes and other liabilities/Revenues 5.1% Capital expenditures/Revenues 2.5% Dividends/Net income 28.3% Current portion of L/T debt due in 2015 $46 Forecasting the Income Statement, Balance Sheet, and Statement of Cash Flows The following are the financial statements of Nike, Inc. Consolidated Statements of Income Year ended May 31 (in Millions) 2013 2012 2011 Income from continuing operations: Revenues $25,313 $23,331 $20,117 Cost of sales 14,279 13,183 10,915 Gross profit 11,034 10,148 9,202 Demand creation expense 2,745 2,607 2,344 Operating overhead expense 5,035 4,458 4,017 Total selling and administrative expense 7,780 7,065 6,361 Interest expense (income), net (3) 4 4 Other (income) (15) 54 (25) Income before income taxes 3,272 3,025 2,862 Income tax expense 808 756 690 Net income from continuing operations 2,464 2,269 2,172 Net income (loss) from discontinued operations 21 (46) (39) Net income $2,485 $2,223 $2,133 Instructions: Forecast Nike's fiscal year 2014 stastement of cash flows. Use negative signs with your answers below, when appropriate. Nike's Forecasted Statement of Cash Flows Net income Add: depreciation Add: amortization ($ millions) 2014 Est. Change in Accounts receivable Change in Inventories Change in Deferred income taxes Change in Prepaid expenses & other current assets Change in LT Deferred income taxes & other assets Change in Accounts payable Change in Accrued liabilities Change in Income taxes payable Change in LT Deferred income taxes and other liabilities Net cash from operating activities Capital expenditures Net cash from investing activities Dividends Payments of LT debt Net cash from financing activities Net change in cash Beginning cash Ending cash +A In Millions Consolidated Balance Sheets 2013 2012 Assets Cash and equivalents $3,337 $2,317 Short-term investments 2,628 1,440 Accounts receivable, net 3,117 3,132 Inventories 3,434 3,222 Deferred income taxes 308 262 Prepaid expenses and other current assets 802 857 Assets of discontinued operations 615 Total current assets 13,626 11,845 Property, plant and equipment, net 2,452 2,209 Identifiable intangible assets (net) 382 370 Goodwill 131 131 993 910 Deferred income taxes and other assets Total assets Liabilities and Shareholders' Equity $ 17,584 $15,465 Current liabilities: Current portion of long-term debt $ 57 $ 49 Notes payable 121 108 Accounts payable 1,646 1,549 Accrued liabilities 1,986 1,941 Income taxes payable 98 65 Liabilities of discontinued operations 18 170 Total current liabilities 3,926 3,882 Long-term debt 1,210 228 Deferred income taxes and other liabilities 1,292 974 Total liabilities 6,428 5,084 Redeemable preferred stock Shareholders' Equity Common sotck at stated value Class A covertible 178 and 180 shares outstanding Class B-716 and 736 shares outstanding Capital in excess of stated value Accumulated other comprehensive income Retained earnings Total shareholders' equity Total liabilities and shareholders' equity 3 3 5,184 4,641 274 149 5,695 5,588 11,156 10,381 $ 17,584 $15,465 We forecast Nike using the following forecast assumptions: Revenue growth based on growth in revenues from 2012 to 2013 8.0% Cost of sales/Revenues 56.4% Demand creation expense/Revenues 10.8% Operating overhead expenses/Revenues 19.9% Net Income from discontinued operations $0 Income tax expense/Income before income taxes 24.7% Instructions: Forecast Nike's fiscal year 2014 income statement. • Assume no change for other income and interest income. • Round forecasts to $ millions. • Do not use negative signs with your answers in the income statement. Nike's Forecasted Income Statement ($ millions) Revenues Cost of sales Gross profit Demand creation expense Operating overhead expense Interest income, net Other income Income before income taxes Income taxes Net income 2014 $ $ Instructions: Forecast Nike's fiscal year 2014 balance sheet. • Assume no change for: short-term investments, goodwill, notes payable, liabilities from discontinued operations, common stock, capital in excess of stated value and accumulated other comprehensive income. • Round forecasts to $ millions. We forecast Nike's balance sheet using the following forecast assumptions: Accounts receivable/Revenues Inventories/Revenues 12.3% 13.6% Deferred income taxes/Revenues 1.2% Prepaid expenses and other current assets/Revenues 3.2% Depreciation expense/Prior-year PPE, net (incl. in overhead) 19.8% Amortization expense $78 L-T deferred income taxes and other assets/Revenues 3.9% Accounts payable/Revenues 6.5% Accrued liabilities/Revenues 7.8% Income taxes payable/Revenues 0.4% Deferred income taxes and other liabilities/Revenues 5.1% Capital expenditures/Revenues 2.5% Dividends/Net income 28.3% Current portion of L/T debt due in 2015 $46
Expert Answer:
Answer rating: 100% (QA)
Answer 1 Nikes Forecasted Income Statement millions 2013 2014 Revenues 25313 27338 Cost of sales 14279 15419 Gross margin 11034 11919 Demand creation expense 2745 2953 Operating overhead expense 5035 ... View the full answer

Related Book For 

Financial Reporting Financial Statement Analysis and Valuation a strategic perspective
ISBN: 978-1337614689
9th edition
Authors: James M. Wahlen, Stephen P. Baginski, Mark Bradshaw
Posted Date:
Students also viewed these accounting questions
-
What human trafficking theory helps explain the extensive sex trafficking ring, orchestrated by Jeffrey Epstein? What are the push and pull factors involved that resulted in the increased numbers of...
-
Read the case study "Southwest Airlines," found in Part 2 of your textbook. Review the "Guide to Case Analysis" found on pp. CA1 - CA11 of your textbook. (This guide follows the last case in the...
-
In Exercises simplify the ratio of factorials. (n + 1)! n!
-
(a) What object distance is required to give an image with a magnification of +2.0? Assume that the focal length of the lens is +5.0 cm. (b) What is the location of the image in this case?
-
A resistance heater operates inside a tank consuming 0.5 kW of electricity. Due to heat transfer to the ambient atmosphere at 300 K, the tank is maintained at a steady state. The surface temperature...
-
Discuss how a collaboration diagram represents the organization of objects that must cooperate to reach an objective.
-
Debbie Davis and Elizabeth Engels Exchanged like kind property. Debbie had an adjusted basis of $12,000 in her property (Fair Market value is $15,000). Elizabeths property had an adjusted basis of...
-
Cybersecurity and Infrastructure Security Agency Act Discussion 3 - Cybersecurity and Infrastructure Security Agency Act Cybersecurity and Infrastructure Security Agency Act Read through the article...
-
1 walmart uses the straightline depreciation method for financial reporting and accelerated depreciation for income tax reporting like most firms, the largest deferred tax liability is for property,...
-
Suppose P1, is the stock price index for country 1, P2, is the stock price index for country 2 and P3, is the stock price index for country 3. The researcher believes that the stock price indexes are...
-
An economy is characterized by the following behavioral equations: C = 0.75% + 100-25r I=1226-30r G = 600 T=520 IM = 0.15Y - 2700 + 280E EX=0.1Y* 250E = 3% = 0.5 Y* is foreign output. E is the...
-
a) A fishery is regulated by a total catch quota (TAC = Q). The TAC is a random variable which varies between the limits minQ = 0 and maxQ = 1. The cumulative frequency distribution is FQ) = Q....
-
The inverse demand function for a certain type of fish is given as p = Ay", where p is the price of fish, y is the quantity sold, and A and b are parameters. a) What is the price elasticity of...
-
. Snappy Petroleum is planning to drill a well. The expected costs and revenues in terms of money in "Time 0" are: the drilling cost: $2,050.000; the variable costs of production: $19 per barrel; ...
-
Determine the following: -organizational chart -stakeholder register -charter -scope statement -WBS -Schedule assignment -cost assignment -earned value assignment Wilmont's is a top-ranked US retail...
-
You continue to work in the corporate office for a nationwide convenience store franchise that operates nearly 10,000 stores. The per- store daily customer count (i.e., the mean number of customers...
-
Financial reporting classifies derivatives as (a) speculative investments, (b) fair value hedges, or (c) cash flow hedges. However, firms revalue all derivatives to market value each period...
-
The ordering of the three sections of the statement of cash flows is backwards for start-up firms, but it is more appropriate for businesses once they are up and running. Explain.
-
Vulcan Materials Company, a member of the S&P 500 Index, is the nations largest producer of construction aggregates, a major producer of asphalt mix and concrete, and a leading producer of cement in...
-
Why can staging investment decisions add value?
-
How do you use a decision tree to make the best investment decision?
-
How can you identify a real option in a decision tree?

Study smarter with the SolutionInn App