

Recall that, each year, Fortune Magazine presents rankings of Americas leading businesswomen, including lists of the most
Question:
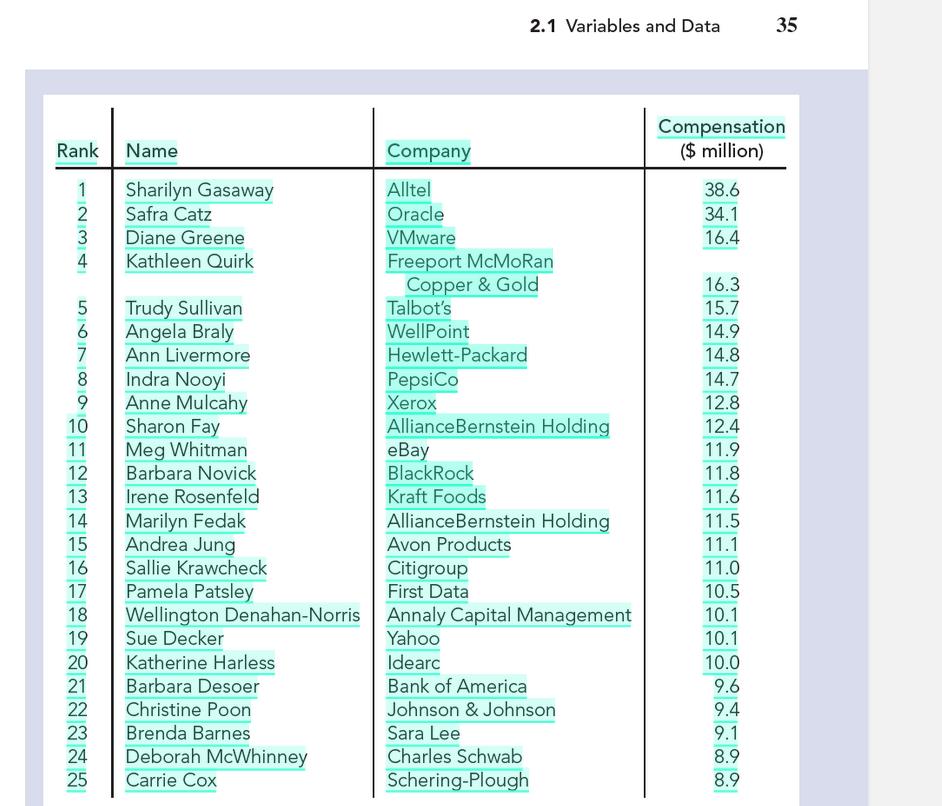
Recall that, each year, Fortune Magazine presents rankings of America’s leading businesswomen, including lists of the most powerful, highest paid, youngest, and “movers.” On page 35, we displayed a table showing Fortune’s list of the 25 highest paid women.
a. For each of the four columns of the table, classify the data as either qualitative or quantitative; if quantitative, further classify it as discrete or continuous. Also identify the variable under consideration in each case.
b. Use cutpoint grouping to organize the compensation data into frequency and relative-frequency distributions. Use a class width of 5 and a first cutpoint of 5.
c. Construct frequency and relative-frequency histograms of the compensation data based on your grouping in part (b).
d. Identify and interpret the shape of your histograms in part (c).
e. Truncate each compensation to a whole number (i.e., find the greatest integer in each compensation), and then obtain a stem-and-leaf diagram of the resulting data, us- ing two lines per stem.
f. Round each compensation to a whole number, and then obtain a stem-and-leaf diagram of the resulting data, us- ing two lines per stem.
g. Which of the stem-and-leaf diagrams in parts (e) and (f ) corresponds to the frequency histogram in part (c)? Can you explain why?
h. Round each compensation to a whole number, and then obtain a dotplot of the resulting data.
Expert Answer:
From the given information a The Qualitative frequency table is and the Frequen... View the full answer


Essentials of Business Statistics Communicating With Numbers
ISBN: 978-0078020544
1st edition
Authors: Sanjiv Jaggia, Alison Kelly
