

Founded in 2006 by two brothers who love to hunt and fish (Roy and Ryan Seiders), Yeti
Question:
Founded in 2006 by two brothers who love to hunt and fish (Roy and Ryan Seiders), Yeti quickly established itself as a provider of high-quality outdoor equipment and completed its initial public offering (IPO) in October 2018. After overseeing rapid sales growth for many years, Yeti's Chief Financial Officer, Paul Carbone, found himself pondering how to position the company given the onset of COVID-19, a challenge unlike any he had faced.
The executive team had just held the earnings call for the first quarter of 2020, during which Chris had highlighted the 21% year-over-year growth in sales experienced through mid-March alongside the subsequent 25% decrease in sales in the final two weeks of the quarter. Management quickly responded by accepting a cut in compensation, furloughing a portion of retail staff, and tightening operating and capital expenditures, and Paul publicly withdrew the company's 2020 earnings forecast given the uncertain operating conditions. As he looked to the second quarter, one factor was obvious: brick-and-mortar stores would likely remain closed - limiting sales attainable through Yeti's retail stores and the stores of its wholesale partners - so Yeti would need to focus on attracting and selling to customers online.
The company tracks financial performance by channel, identifying sales as either originating from wholesale partners or from end customers (i.e., direct-to-consumer sales). While wholesale sales were up 13% year-over-year as of mid-March, the impact of retail store closures was evident as wholesale sales plummeted by 43% in the last two weeks of the quarter. In contrast, direct-to consumer sales had held relatively steady, experiencing a 31% increase through mid-March and a 15% increase in the next two weeks. With retail stores closed for the foreseeable future and the company's focus on marketing to customers online, Paul expected that the company's direct-to-customer channel would contribute an increasing proportion of sales in the coming months.
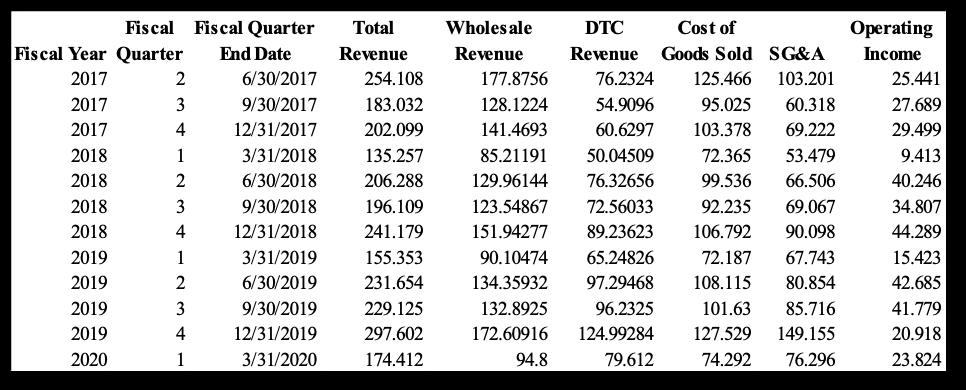
To project earnings for the second quarter of 2020, Paul knew he had to understand how costs would change given a shift towards more direct-to-consumer business. He gathered sales, cost and income data - separately identifying the sales attributable to the wholesale and direct-to-consumer channels - for the last two and a half years as presented in Exhibit 1.
To help Paul understand how costs and operating profits may change given a shift in Yeti's business, use the data presented in Exhibit 1 (this data is available as a STATA dataset file on Canvas) and follow the steps outlined in Exhibit 3 to complete the following:
Step 1: Run the following regression models:
Cost of Goods Soldt = β0 + β1Total Revenuet + ɛt
SG&At = β0 + β1Total Revenuet + ɛt
Step 2: Create two graphs - one for Cost of Goods Sold and another for SG&A - that plot the actual quarterly costs and revenues and the fitted regression line.
Step 3: Run the following regression models:
Cost of Goods Soldt = β0 + β1Wholesale Revenuet + β2DTC Revenuet + ɛt
SG&At = β0 + β1Wholesale Revenuet + β2DTC Revenuet + ɛt
Answer the following.
Based on the regression outputs from Step 1, answer the following questions:
- What does the β0 estimate represent? Interpret the regression estimates for Cost of Goods Sold and SG&A.
- What does the β1 estimate represent? Interpret the regression estimates for Cost of Goods Sold and SG&A.
- Why would we run separate regressions for Cost of Goods Sold and SG&A instead of regressing total costs on total revenue?
Based on the regression outputs and graphs from Steps 2 and 3, answer the following questions:
- What do β1 and β2 coefficient estimates represent? Interpret the regression estimates for Cost of Goods Sold and SG&A.
- Discuss how these estimates compare to your β1 estimates from Step 1 for Cost of Goods Sold and SG&A. Explain whether one set of estimates would prove more helpful for prediction and decision-making purposes and why.
- Do the estimates suggest that the Wholesale channel is more or less profitable than the DTC channel?
- Notice that the β0 coefficient estimates are negative when you regress SG&A. One driver is the outlier that should be evident in your SG&A graphs: SG&A expenses in 2019 Q4 were abnormally high as a percentage of revenue (roughly 50% while this percentage usually ranges between 35 and 44%). This outlier is causing the slope of the fitted line to be steeper than what we would probably expect. In the Q4 2019 earnings call, Yeti management stated that SG&A included a one-time $40.7 million non-cash stock-based compensation expense item related to pre-IPO performance-based awards. Given this explanation, lower the 2019 Q4 SG&A expense for this one-time charge and calculate revised β0, β1 andβ2 coefficients for the SG&A regression.
- Assume Paul is forecasting total revenue of $246.9 million for the second quarter of 2020, comprising sales in the DTC channel of $133 million and sales in the Wholesale channel of $113.9 million. What do you project for the company's operating profit, where operating profit = revenue - cost of goods sold - SG&A? Use your regression estimates after adjusting 2019 Q4's SG&A expense.
- What factors are important to consider (and potentially adjust for) when using your regression estimates?
Expert Answer:
Step 1 Run simple regressions for Cost of Goods Sold COGS and Selling General and Administrative Expenses SGA COGSt01TotalRevenuett SGAt01TotalRevenuett What does the 0 estimate represent The 0 estima... View the full answer


Auditing a business risk appraoch
ISBN: 978-0324375589
6th Edition
Authors: larry e. rittenberg, bradley j. schwieger, karla m. johnston
