

Frequency Table Activity 1. A researcher studies the effects of having pets on stress levels. The...
Fantastic news! We've Found the answer you've been seeking!
Question:
Transcribed Image Text:
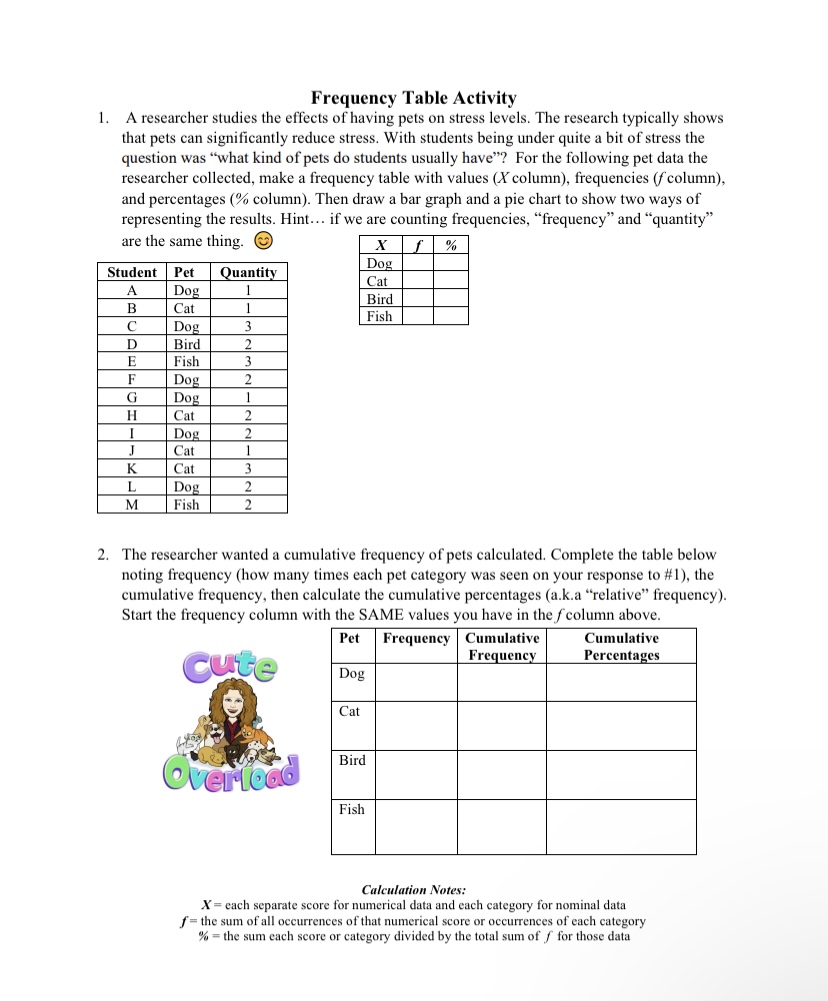
Frequency Table Activity 1. A researcher studies the effects of having pets on stress levels. The research typically shows that pets can significantly reduce stress. With students being under quite a bit of stress the question was "what kind of pets do students usually have"? For the following pet data the researcher collected, make a frequency table with values (X column), frequencies (f column), and percentages (% column). Then draw a bar graph and a pie chart to show two ways of representing the results. Hint... if we are counting frequencies, "frequency" and "quantity" are the same thing. Xf Dog % Student Pet Quantity Cat A Dog 1 Bird B Cat 1 Fish Dog 3 D Bird E Fish 3 F Dog 2 G Dog 1 H Cat 2 I Dog 2 J Cat 1 K Cat 3 L Dog 2 M Fish 2 2. The researcher wanted a cumulative frequency of pets calculated. Complete the table below noting frequency (how many times each pet category was seen on your response to #1), the cumulative frequency, then calculate the cumulative percentages (a.k.a "relative" frequency). Start the frequency column with the SAME values you have in the f column above. Pet Frequency Cumulative Frequency Cumulative Percentages Cute Dog Cat Overload Bird Fish Calculation Notes: X each separate score for numerical data and each category for nominal data f=the sum of all occurrences of that numerical score or occurrences of each category % the sum each score or category divided by the total sum off for those data Frequency Table Activity 1. A researcher studies the effects of having pets on stress levels. The research typically shows that pets can significantly reduce stress. With students being under quite a bit of stress the question was "what kind of pets do students usually have"? For the following pet data the researcher collected, make a frequency table with values (X column), frequencies (f column), and percentages (% column). Then draw a bar graph and a pie chart to show two ways of representing the results. Hint... if we are counting frequencies, "frequency" and "quantity" are the same thing. Xf Dog % Student Pet Quantity Cat A Dog 1 Bird B Cat 1 Fish Dog 3 D Bird E Fish 3 F Dog 2 G Dog 1 H Cat 2 I Dog 2 J Cat 1 K Cat 3 L Dog 2 M Fish 2 2. The researcher wanted a cumulative frequency of pets calculated. Complete the table below noting frequency (how many times each pet category was seen on your response to #1), the cumulative frequency, then calculate the cumulative percentages (a.k.a "relative" frequency). Start the frequency column with the SAME values you have in the f column above. Pet Frequency Cumulative Frequency Cumulative Percentages Cute Dog Cat Overload Bird Fish Calculation Notes: X each separate score for numerical data and each category for nominal data f=the sum of all occurrences of that numerical score or occurrences of each category % the sum each score or category divided by the total sum off for those data
Expert Answer:

Posted Date:
Students also viewed these mathematics questions
-
Ann Chovies, owner of the Perfect Pasta Pizza Parlor, uses 20 pounds of pepperoni each day in preparing pizzas. Order costs for pepperoni are $10.00 per order, and carrying costs are 4 cents per...
-
CANMNMM January of this year. (a) Each item will be held in a record. Describe all the data structures that must refer to these records to implement the required functionality. Describe all the...
-
Determine the vector A-C, given the vectors A and C in the figure. (Figure 1) Figure B (B=26.5) 56.0% (A = 44.0) 28.0 C(C= 31.0) 1 of 1 Determine the magnitude of the vector A - . Express your...
-
The American Accounting Association holds its regional meetings at seven locations in the spring and its national meeting in August of each year. The meetings include the formal presentation of...
-
Discuss how group norms are formed and sustained within groups.
-
Landon Company makes two models of childrens playhouses, the Castle and the Mansion. Basic production information follows: Landon has monthly overhead of $219,000, which is divided into the following...
-
Troy Engines, Ltd., manufactures a variety of engines for use in heavy equipment. The company has always produced all of the necessary parts for its engines, including all of the carburetors. An...
-
For this assignment, please submit one Excel file . Use a separate sheet for each question. Name each sheet as question number. To rename a worksheet, right-click the worksheet tab located at the...
-
For the tank shown in Fig. 6.24, calculate the volume flow rate of water from the nozzle. The tank is sealed with a pressure of 138 kPa above the water. The depth h is 2.5 m. 3. Air under prese Water...
-
Which of the following is not a purpose of a subprocess in BPMN? a. Reducing complexity b. Presenting higher-level process descriptions c. Creating alternative process flows d. Developing a reusable...
-
A UML model Ultra Light Style of a business process has (a) activity diagram (b) activity diagram and list of participants (c) activity diagram and class diagram (d) None of these
-
A UML model precise style of a business process has (a) activity diagram (b) activity diagram and list of participants (c) activity diagram and class diagram (d) None of the above
-
Which of the following describes the purpose of a lane within a pool in BPMN? a. Indicates the start of the process b. Indicates the end of the process c. Identifies different activity flow options...
-
An information system that measures and records accounting transactions and reports them in the financial statements is called a a. financial reporting system (FRS). b. enterprise system (ES). c....
-
Orlando Medical Corporation Consolidated Statements of Financial Position December 31, (In Millions) 2014 2013 Assets: Current assets Cash and cash equivalents $4,344 $4,237 Accounts and notes...
-
Find the inverse, if it exists, for the matrix. -1
-
Assume you are advising a client on whether to operate in new states with multiple tax incentives. However, the client firm has never had any business connections to the states before. What are the...
-
Which of these are informative for determining the tax residence of a multiple-home taxpayer? A. Time spent in state relative to other states B. Time spent in state by immediate family C....
-
State auditors typically ask about/for which of the following when determining residency? A. All state drivers licenses B. Previous and other current addresses within and without the state C. The...

Study smarter with the SolutionInn App