

g Eon Industries is deciding whether to automate one phase of its production process. The manufacturing...
Fantastic news! We've Found the answer you've been seeking!
Question:
Transcribed Image Text:
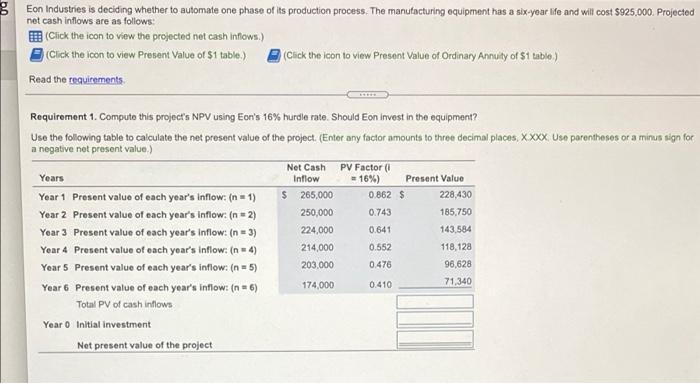
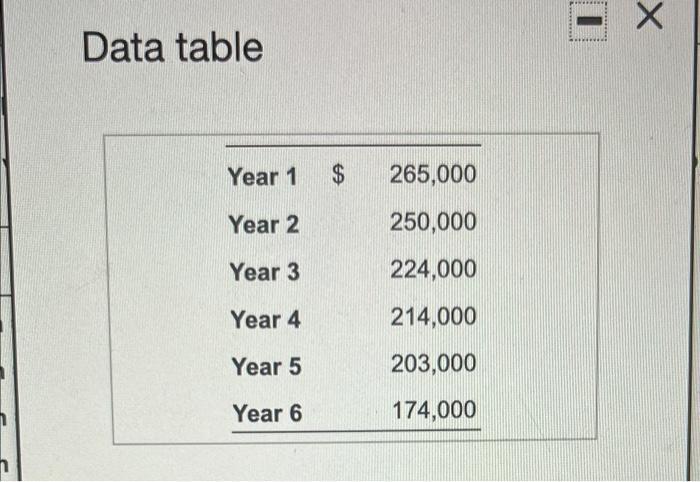
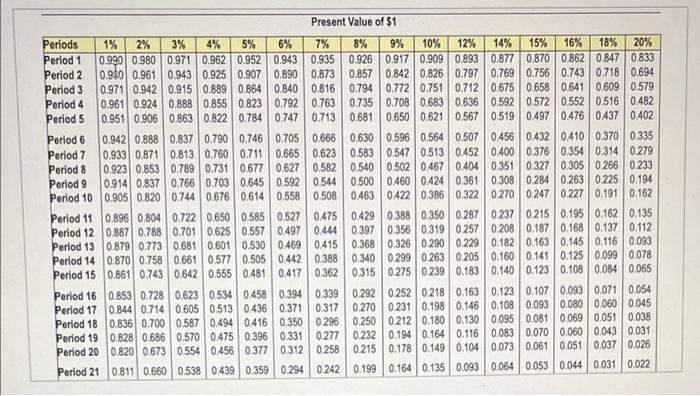
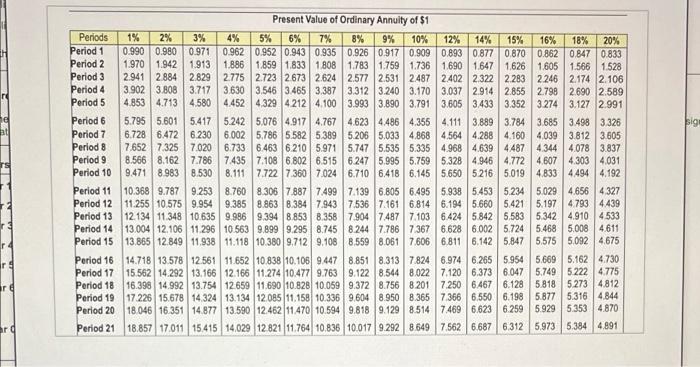
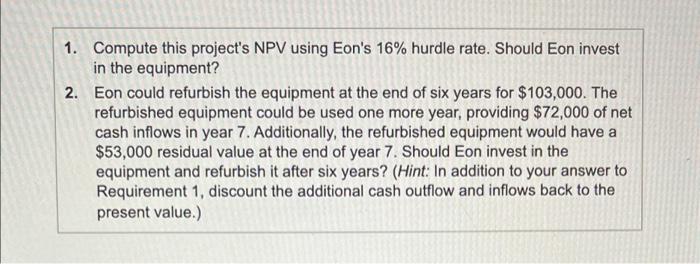
g Eon Industries is deciding whether to automate one phase of its production process. The manufacturing equipment has a six-year life and will cost $925,000. Projected net cash inflows are as follows: (Click the icon to view the projected net cash inflows.) (Click the icon to view Present Value of $1 table.) Read the requirements Requirement 1. Compute this project's NPV using Eon's 16 % hurdle rate. Should Eon invest in the equipment? Use the following table to calculate the net present value of the project. (Enter any factor amounts to three decimal places, XXXX Use parentheses or a minus sign for a negative net present value.) Years Year 1 Year 2 Year 3 Year 4 Year 5 Present value of each year's inflow: (n = 1) Present value of each year's inflow: (n=2) Present value of each year's inflow: (n = 3) Present value of each year's inflow: (n = 4) Present value of each year's inflow: (n = 5) Year 6 Present value of each year's inflow: (n = 6) Total PV of cash inflows Year 0 Initial investment (Click the icon to view Present Value of Ordinary Annuity of $1 table.) Net present value of the project Net Cash Inflow $ 265,000 250,000 224,000 214,000 203,000 174,000 PV Factor ( = 16%) 0.862 $ 0.743 0.641 0.552 0.476 0.410 Present Value 228,430 185,750 143,584 118,128 96,628 71,340 Data table Year 1 $ Year 2 Year 3 Year 4 Year 5 Year 6 265,000 250,000 224,000 214,000 203,000 174,000 X Periods Period 1 Period 2 Period 3 Period 4 Period 5 Period 6 Period 7 Period 8 Period 9 Period 10 Period 11 Period 12 Period 13 Period 14 Period 15 Period 16 Period 17 Period 18 Period 19 Period 20 Present Value of $1 1% 2% 3% 5% 4% 6% 7% 8% 9% 10% 12% 14% 15% 16% 18% 20% 0.990 0.980 0.971 0.962 0.952 0.943 0.935 0.926 0.917 0.909 0.893 0.877 0.870 0.862 0.847 0.833 0.980 0.961 0.943 0.925 0.907 0.890 0.873 0.857 0.842 0.826 0.797 0.769 0.756 0.743 0.718 0.694 0.971 0.942 0.915 0.889 0.864 0.840 0.816 0.794 0.772 0.751 0.712 0.658 0.641 0.609 0.579 0.961 0.924 0.888 0.855 0.823 0.792 0.763 0.572 0.552 0.516 0.482 0.951 0.906 0.863 0.822 0.784 0.747 0.713 0.681 0.650 0.621 0.567 0.519 0.497 0.476 0.437 0.402 0.675 0.735 0.708 0.683 0.636 0.592 0.790 0.746 0.705 0.666 0.665 0.623 0.627 0.582 0.760 0.711 0.731 0.677 0.766 0.703 0.645 0.592 0.544 0.942 0.888 0.837 0.813 0.933 0.871 0.923 0.853 0.789 0.914 0.837 0.905 0.820 0.744 0.676 0.614 0.630 0.596 0.564 0.507 0.583 0.547 0.513 0.452 0.540 0.502 0.467 0.404 0.500 0.460 0424 0.361 0.558 0.508 0.463 0.429 0.388 0.350 0.287 0.397 0.356 0.319 0.257 0.208 0.368 0.326 0.290 0.229 0.182 0.340 0.299 0.263 0.205 0.160 0.315 0.896 0.804 0.722 0.650 0.585 0.527 0475 0.887 0.788 0.701 0.625 0.557 0.497 0.444 0.879 0.773 0.681 0.601 0.530 0.469 0.415 0.870 0.758 0.661 0.577 0.505 0.442 0.388 0.642 0.555 0.481 0.417 0.362 0.861 0.743 0.853 0.728 0.844 0.714 0.836 0.700 0.587 0.494 0.416 0.828 0.686 0.570 0.475 0.396 0.673 0.554 0.456 0.377 0.439 0.359 0.294 0242 0.623 0.534 0.458 0.394 0.339 0.605 0.513 0.436 0.371 0.317 0.350 0.296 0.331 0.277 0.312 0.258 0.820 Period 21 0.811 0.660 0.538 0.456 0.432 0410 0.370 0.335 0.400 0.376 0.354 0.314 0.279 0.351 0.327 0.305 0.266 0.233 0.308 0.284 0.263 0.225 0.194 0.422 0.386 0.322 0.270 0.247 0.227 0.191 0.162 0.237 0.215 0.195 0.162 0.135 0.187 0.168 0.137 0.112 0.163 0.145 0.116 0.093 0.141 0.125 0.099 0.078 0.275 0.239 0.183 0.140 0.123 0.108 0.084 0.065 0.292 0.252 0.218 0.163 0.123 0.107 0.093 0.071 0.054 0.270 0.231 0.198 0.146 0.108 0.093 0.080 0.060 0.045 0.250 0.212 0.180 0.130 0.095 0.081 0.069 0.051 0.038 0.232 0.194 0.164 0.116 0.083 0.070 0.060 0.043 0.031 0.215 0.178 0.149 0.104 0.073 0.061 0.051 0.037 0.026 0.199 0.164 0.135 0.093 0.064 0.053 0.044 0.031 0.022 ré ar q Periods 1% 2% Period 1 Period 2 Period 3 Period 4 Period 5 Period 6 Period 7 Period 8 Period 9 Period 10 Period 11 Period 12 Period 13 Period 14 Period 15 Period 16 Period 17 Period 18 Period 19 Period 20 Period 21 3% 0.990 0.980 0.971 1.970 1.942 1.913 2.941 2.884 2.829 3.902 3.808 3.717 4.853 4.713 4.580 Present Value of Ordinary Annuity of $1 4% 8% 9% 10% 16% 18% 20% 5% 6% 7% 12% 14% 15% 0.962 0.952 0.943 0.935 0.926 0.917 0.909 0.893 0.877 0.870 0.862 0.847 0.833 1.859 1.833 1.808 1.783 1.759 1.736 1.690 1.647 1.626 1.605 1.566 1.528 2.723 2.673 2.577 2.531 2.487 2.402 2.322 2.283 2.246 2.174 2.106 3.312 3.240 3.170 3.037 2.914 2.855 2.798 2.690 2.589 1.886 2.775 3.630 3.546 3.465 4.329 4.212 2.624 3.387 4.100 4.452 3.993 3.890 3.791 3.605 3.433 3.352 3.274 3.127 2.991 5,076 4.917 4.767 5,786 5.582 5.389 5.795 5.601 5.417 5.242 6.728 6.472 6.230 6.002 7.652 7.325 7.020 6.733 6.463 6.210 5.971 8.566 8.162 7.786 7.435 7.108 6.802 6.515 9.471 8.983 8.530 8.111 7.722 7.360 7.024 10.368 9.787 9.253 8.760 8.306 7.887 7.499 11.255 10.575 9.954 9.385 8.863 8.384 7.943 12.134 11.348 10.635 9.986 9.394 8.853 8.358 13.004 12.106 11.296 10.563 9.899 9.295 8.745 13.865 12.849 11.938 11.118 10.380 9.712 9.108 4.623 4.486 4.355 3.685 3.498 3.326 4.111 3.889 3.784 5.206 5.033 4.868 4.564 4.288 4.160 4.039 3.812 3.605 5.747 5.535 5.335 4.968 4.639 4487 4.344 4.078 3.837 6.247 5.995 5.759 5.328 4.946 4.772 4.607 4.303 4.031 6.710 6.418 6.145 5.650 5.216 5.019 4.833 4.494 4.192 7.139 6.805 6.495 5.938 5.453 5.234 7.536 7.161 6.814 6.194 5.660 5.421 7.904 7.487 7.103 6.424 5.842 5.583 8.244 7.786 7.367 6.628 6.002 5.724 8.559 8.061 7.606 6.811 6.142 5.847 14.718 13.578 12.561 11.652 10.838 10.106 9.447 8.851 8.313 7.824 6.974 6.265 5.954 15.562 14.292 13.166 12.166 11.274 10.477 9.763 9.122 8.544 8.022 7.120 6.373 6.047 16.398 14.992 13.754 12.659 11.690 10.828 10.059 9.372 8.756 8.201 7.250 6.467 6.128 5.818 5.273 4.812 17.226 15.678 14.324 13.134 12.085 11.158 10.336 9.604 8.950 8.365 7.366 6.550 6.198 5.877 5.316 4.844 18.046 16.351 14.877 13.590 12.462 11.470 10.594 9.818 9.129 8.514 7.469 6.623 6.259 5.929 5.353 4.870 7.562 6.687 6.312 5.973 5.384 4.891 5.029 4.656 4.327 5.197 4.793 4.439 5.342 4.910 4.533 5.468 5.008 4.611 5.575 5.092 4.675 5.669 5.162 4.730 5.749 5.222 4.775 18.857 17.011 15.415 14.029 12.821 11.764 10.836 10.017 9.292 8.649 sign 1. Compute this project's NPV using Eon's 16% hurdle rate. Should Eon invest in the equipment? 2. Eon could refurbish the equipment at the end of six years for $103,000. The refurbished equipment could be used one more year, providing $72,000 of net cash inflows in year 7. Additionally, the refurbished equipment would have a $53,000 residual value at the end of year 7. Should Eon invest in the equipment and refurbish it after six years? (Hint: In addition to your answer to Requirement 1, discount the additional cash outflow and inflows back to the present value.) g Eon Industries is deciding whether to automate one phase of its production process. The manufacturing equipment has a six-year life and will cost $925,000. Projected net cash inflows are as follows: (Click the icon to view the projected net cash inflows.) (Click the icon to view Present Value of $1 table.) Read the requirements Requirement 1. Compute this project's NPV using Eon's 16 % hurdle rate. Should Eon invest in the equipment? Use the following table to calculate the net present value of the project. (Enter any factor amounts to three decimal places, XXXX Use parentheses or a minus sign for a negative net present value.) Years Year 1 Year 2 Year 3 Year 4 Year 5 Present value of each year's inflow: (n = 1) Present value of each year's inflow: (n=2) Present value of each year's inflow: (n = 3) Present value of each year's inflow: (n = 4) Present value of each year's inflow: (n = 5) Year 6 Present value of each year's inflow: (n = 6) Total PV of cash inflows Year 0 Initial investment (Click the icon to view Present Value of Ordinary Annuity of $1 table.) Net present value of the project Net Cash Inflow $ 265,000 250,000 224,000 214,000 203,000 174,000 PV Factor ( = 16%) 0.862 $ 0.743 0.641 0.552 0.476 0.410 Present Value 228,430 185,750 143,584 118,128 96,628 71,340 Data table Year 1 $ Year 2 Year 3 Year 4 Year 5 Year 6 265,000 250,000 224,000 214,000 203,000 174,000 X Periods Period 1 Period 2 Period 3 Period 4 Period 5 Period 6 Period 7 Period 8 Period 9 Period 10 Period 11 Period 12 Period 13 Period 14 Period 15 Period 16 Period 17 Period 18 Period 19 Period 20 Present Value of $1 1% 2% 3% 5% 4% 6% 7% 8% 9% 10% 12% 14% 15% 16% 18% 20% 0.990 0.980 0.971 0.962 0.952 0.943 0.935 0.926 0.917 0.909 0.893 0.877 0.870 0.862 0.847 0.833 0.980 0.961 0.943 0.925 0.907 0.890 0.873 0.857 0.842 0.826 0.797 0.769 0.756 0.743 0.718 0.694 0.971 0.942 0.915 0.889 0.864 0.840 0.816 0.794 0.772 0.751 0.712 0.658 0.641 0.609 0.579 0.961 0.924 0.888 0.855 0.823 0.792 0.763 0.572 0.552 0.516 0.482 0.951 0.906 0.863 0.822 0.784 0.747 0.713 0.681 0.650 0.621 0.567 0.519 0.497 0.476 0.437 0.402 0.675 0.735 0.708 0.683 0.636 0.592 0.760 0.711 0.790 0.746 0.705 0.666 0.665 0.623 0.627 0.582 0.731 0.677 0.766 0.703 0.645 0.592 0.544 0.942 0.888 0.837 0.813 0.933 0.871 0.923 0.853 0.789 0.914 0.837 0.905 0.820 0.744 0.676 0.614 0.630 0.596 0.564 0.507 0.583 0.547 0.513 0.452 0.540 0.502 0.467 0.404 0.500 0.460 0424 0.361 0.558 0.508 0.463 0.429 0.388 0.350 0.287 0.397 0.356 0.319 0.257 0.208 0.368 0.326 0.290 0.229 0.182 0.340 0.299 0.263 0.205 0.160 0.315 0.896 0.804 0.722 0.650 0.585 0.527 0475 0.887 0.788 0.701 0.625 0.557 0.497 0.444 0.879 0.773 0.681 0.601 0.530 0.469 0.415 0.870 0.758 0.661 0.577 0.505 0.442 0.388 0.642 0.555 0.481 0.417 0.362 0.861 0.743 0.853 0.728 0.844 0.714 0.836 0.700 0.587 0.494 0.416 0.828 0.686 0.570 0.475 0.396 0.673 0.554 0.456 0.377 0.439 0.359 0.294 0242 0.623 0.534 0.458 0.394 0.339 0.605 0.513 0.436 0.371 0.317 0.350 0.296 0.331 0.277 0.312 0.258 0.820 Period 21 0.811 0.660 0.538 0.456 0.432 0410 0.370 0.335 0.400 0.376 0.354 0.314 0.279 0.351 0.327 0.305 0.266 0.233 0.308 0.284 0.263 0.225 0.194 0.422 0.386 0.322 0.270 0.247 0.227 0.191 0.162 0.237 0.215 0.195 0.162 0.135 0.187 0.168 0.137 0.112 0.163 0.145 0.116 0.093 0.141 0.125 0.099 0.078 0.275 0.239 0.183 0.140 0.123 0.108 0.084 0.065 0.292 0.252 0.218 0.163 0.123 0.107 0.093 0.071 0.054 0.270 0.231 0.198 0.146 0.108 0.093 0.080 0.060 0.045 0.250 0.212 0.180 0.130 0.095 0.081 0.069 0.051 0.038 0.232 0.194 0.164 0.116 0.083 0.070 0.060 0.043 0.031 0.215 0.178 0.149 0.104 0.073 0.061 0.051 0.037 0.026 0.199 0.164 0.135 0.093 0.064 0.053 0.044 0.031 0.022 ré ar q Periods 1% 2% Period 1 Period 2 Period 3 Period 4 Period 5 Period 6 Period 7 Period 8 Period 9 Period 10 Period 11 Period 12 Period 13 Period 14 Period 15 Period 16 Period 17 Period 18 Period 19 Period 20 Period 21 3% 0.990 0.980 0.971 1.970 1.942 1.913 2.941 2.884 2.829 3.902 3.808 3.717 4.853 4.713 4.580 Present Value of Ordinary Annuity of $1 4% 8% 9% 10% 16% 18% 20% 5% 6% 7% 12% 14% 15% 0.962 0.952 0.943 0.935 0.926 0.917 0.909 0.893 0.877 0.870 0.862 0.847 0.833 1.859 1.833 1.808 1.783 1.759 1.736 1.690 1.647 1.626 1.605 1.566 1.528 2.723 2.673 2.577 2.531 2.487 2.402 2.322 2.283 2.246 2.174 2.106 3.312 3.240 3.170 3.037 2.914 2.855 2.798 2.690 2.589 1.886 2.775 3.630 3.546 3.465 4.329 4.212 2.624 3.387 4.100 4.452 3.993 3.890 3.791 3.605 3.433 3.352 3.274 3.127 2.991 5,076 4.917 4.767 5,786 5.582 5.389 5.795 5.601 5.417 5.242 6.728 6.472 6.230 6.002 7.652 7.325 7.020 6.733 6.463 6.210 5.971 8.566 8.162 7.786 7.435 7.108 6.802 6.515 9.471 8.983 8.530 8.111 7.722 7.360 7.024 10.368 9.787 9.253 8.760 8.306 7.887 7.499 11.255 10.575 9.954 9.385 8.863 8.384 7.943 12.134 11.348 10.635 9.986 9.394 8.853 8.358 13.004 12.106 11.296 10.563 9.899 9.295 8.745 13.865 12.849 11.938 11.118 10.380 9.712 9.108 4.623 4.486 4.355 3.685 3.498 3.326 4.111 3.889 3.784 5.206 5.033 4.868 4.564 4.288 4.160 4.039 3.812 3.605 5.747 5.535 5.335 4.968 4.639 4487 4.344 4.078 3.837 6.247 5.995 5.759 5.328 4.946 4.772 4.607 4.303 4.031 6.710 6.418 6.145 5.650 5.216 5.019 4.833 4.494 4.192 7.139 6.805 6.495 5.938 5.453 5.234 7.536 7.161 6.814 6.194 5.660 5.421 7.904 7.487 7.103 6.424 5.842 5.583 8.244 7.786 7.367 6.628 6.002 5.724 8.559 8.061 7.606 6.811 6.142 5.847 14.718 13.578 12.561 11.652 10.838 10.106 9.447 8.851 8.313 7.824 6.974 6.265 5.954 15.562 14.292 13.166 12.166 11.274 10.477 9.763 9.122 8.544 8.022 7.120 6.373 6.047 16.398 14.992 13.754 12.659 11.690 10.828 10.059 9.372 8.756 8.201 7.250 6.467 6.128 5.818 5.273 4.812 17.226 15.678 14.324 13.134 12.085 11.158 10.336 9.604 8.950 8.365 7.366 6.550 6.198 5.877 5.316 4.844 18.046 16.351 14.877 13.590 12.462 11.470 10.594 9.818 9.129 8.514 7.469 6.623 6.259 5.929 5.353 4.870 7.562 6.687 6.312 5.973 5.384 4.891 5.029 4.656 4.327 5.197 4.793 4.439 5.342 4.910 4.533 5.468 5.008 4.611 5.575 5.092 4.675 5.669 5.162 4.730 5.749 5.222 4.775 18.857 17.011 15.415 14.029 12.821 11.764 10.836 10.017 9.292 8.649 sign 1. Compute this project's NPV using Eon's 16% hurdle rate. Should Eon invest in the equipment? 2. Eon could refurbish the equipment at the end of six years for $103,000. The refurbished equipment could be used one more year, providing $72,000 of net cash inflows in year 7. Additionally, the refurbished equipment would have a $53,000 residual value at the end of year 7. Should Eon invest in the equipment and refurbish it after six years? (Hint: In addition to your answer to Requirement 1, discount the additional cash outflow and inflows back to the present value.) g Eon Industries is deciding whether to automate one phase of its production process. The manufacturing equipment has a six-year life and will cost $925,000. Projected net cash inflows are as follows: (Click the icon to view the projected net cash inflows.) (Click the icon to view Present Value of $1 table.) Read the requirements Requirement 1. Compute this project's NPV using Eon's 16 % hurdle rate. Should Eon invest in the equipment? Use the following table to calculate the net present value of the project. (Enter any factor amounts to three decimal places, XXXX Use parentheses or a minus sign for a negative net present value.) Years Year 1 Year 2 Year 3 Year 4 Year 5 Present value of each year's inflow: (n = 1) Present value of each year's inflow: (n=2) Present value of each year's inflow: (n = 3) Present value of each year's inflow: (n = 4) Present value of each year's inflow: (n = 5) Year 6 Present value of each year's inflow: (n = 6) Total PV of cash inflows Year 0 Initial investment (Click the icon to view Present Value of Ordinary Annuity of $1 table.) Net present value of the project Net Cash Inflow $ 265,000 250,000 224,000 214,000 203,000 174,000 PV Factor ( = 16%) 0.862 $ 0.743 0.641 0.552 0.476 0.410 Present Value 228,430 185,750 143,584 118,128 96,628 71,340 Data table Year 1 $ Year 2 Year 3 Year 4 Year 5 Year 6 265,000 250,000 224,000 214,000 203,000 174,000 X Periods Period 1 Period 2 Period 3 Period 4 Period 5 Period 6 Period 7 Period 8 Period 9 Period 10 Period 11 Period 12 Period 13 Period 14 Period 15 Period 16 Period 17 Period 18 Period 19 Period 20 Present Value of $1 1% 2% 3% 5% 4% 6% 7% 8% 9% 10% 12% 14% 15% 16% 18% 20% 0.990 0.980 0.971 0.962 0.952 0.943 0.935 0.926 0.917 0.909 0.893 0.877 0.870 0.862 0.847 0.833 0.980 0.961 0.943 0.925 0.907 0.890 0.873 0.857 0.842 0.826 0.797 0.769 0.756 0.743 0.718 0.694 0.971 0.942 0.915 0.889 0.864 0.840 0.816 0.794 0.772 0.751 0.712 0.658 0.641 0.609 0.579 0.961 0.924 0.888 0.855 0.823 0.792 0.763 0.572 0.552 0.516 0.482 0.951 0.906 0.863 0.822 0.784 0.747 0.713 0.681 0.650 0.621 0.567 0.519 0.497 0.476 0.437 0.402 0.675 0.735 0.708 0.683 0.636 0.592 0.790 0.746 0.705 0.666 0.665 0.623 0.627 0.582 0.760 0.711 0.731 0.677 0.766 0.703 0.645 0.592 0.544 0.942 0.888 0.837 0.813 0.933 0.871 0.923 0.853 0.789 0.914 0.837 0.905 0.820 0.744 0.676 0.614 0.630 0.596 0.564 0.507 0.583 0.547 0.513 0.452 0.540 0.502 0.467 0.404 0.500 0.460 0424 0.361 0.558 0.508 0.463 0.429 0.388 0.350 0.287 0.397 0.356 0.319 0.257 0.208 0.368 0.326 0.290 0.229 0.182 0.340 0.299 0.263 0.205 0.160 0.315 0.896 0.804 0.722 0.650 0.585 0.527 0475 0.887 0.788 0.701 0.625 0.557 0.497 0.444 0.879 0.773 0.681 0.601 0.530 0.469 0.415 0.870 0.758 0.661 0.577 0.505 0.442 0.388 0.642 0.555 0.481 0.417 0.362 0.861 0.743 0.853 0.728 0.844 0.714 0.836 0.700 0.587 0.494 0.416 0.828 0.686 0.570 0.475 0.396 0.673 0.554 0.456 0.377 0.439 0.359 0.294 0242 0.623 0.534 0.458 0.394 0.339 0.605 0.513 0.436 0.371 0.317 0.350 0.296 0.331 0.277 0.312 0.258 0.820 Period 21 0.811 0.660 0.538 0.456 0.432 0410 0.370 0.335 0.400 0.376 0.354 0.314 0.279 0.351 0.327 0.305 0.266 0.233 0.308 0.284 0.263 0.225 0.194 0.422 0.386 0.322 0.270 0.247 0.227 0.191 0.162 0.237 0.215 0.195 0.162 0.135 0.187 0.168 0.137 0.112 0.163 0.145 0.116 0.093 0.141 0.125 0.099 0.078 0.275 0.239 0.183 0.140 0.123 0.108 0.084 0.065 0.292 0.252 0.218 0.163 0.123 0.107 0.093 0.071 0.054 0.270 0.231 0.198 0.146 0.108 0.093 0.080 0.060 0.045 0.250 0.212 0.180 0.130 0.095 0.081 0.069 0.051 0.038 0.232 0.194 0.164 0.116 0.083 0.070 0.060 0.043 0.031 0.215 0.178 0.149 0.104 0.073 0.061 0.051 0.037 0.026 0.199 0.164 0.135 0.093 0.064 0.053 0.044 0.031 0.022 ré ar q Periods 1% 2% Period 1 Period 2 Period 3 Period 4 Period 5 Period 6 Period 7 Period 8 Period 9 Period 10 Period 11 Period 12 Period 13 Period 14 Period 15 Period 16 Period 17 Period 18 Period 19 Period 20 Period 21 3% 0.990 0.980 0.971 1.970 1.942 1.913 2.941 2.884 2.829 3.902 3.808 3.717 4.853 4.713 4.580 Present Value of Ordinary Annuity of $1 4% 8% 9% 10% 16% 18% 20% 5% 6% 7% 12% 14% 15% 0.962 0.952 0.943 0.935 0.926 0.917 0.909 0.893 0.877 0.870 0.862 0.847 0.833 1.859 1.833 1.808 1.783 1.759 1.736 1.690 1.647 1.626 1.605 1.566 1.528 2.723 2.673 2.577 2.531 2.487 2.402 2.322 2.283 2.246 2.174 2.106 3.312 3.240 3.170 3.037 2.914 2.855 2.798 2.690 2.589 1.886 2.775 3.630 3.546 3.465 4.329 4.212 2.624 3.387 4.100 4.452 3.993 3.890 3.791 3.605 3.433 3.352 3.274 3.127 2.991 5,076 4.917 4.767 5,786 5.582 5.389 5.795 5.601 5.417 5.242 6.728 6.472 6.230 6.002 7.652 7.325 7.020 6.733 6.463 6.210 5.971 8.566 8.162 7.786 7.435 7.108 6.802 6.515 9.471 8.983 8.530 8.111 7.722 7.360 7.024 10.368 9.787 9.253 8.760 8.306 7.887 7.499 11.255 10.575 9.954 9.385 8.863 8.384 7.943 12.134 11.348 10.635 9.986 9.394 8.853 8.358 13.004 12.106 11.296 10.563 9.899 9.295 8.745 13.865 12.849 11.938 11.118 10.380 9.712 9.108 4.623 4.486 4.355 3.685 3.498 3.326 4.111 3.889 3.784 5.206 5.033 4.868 4.564 4.288 4.160 4.039 3.812 3.605 5.747 5.535 5.335 4.968 4.639 4487 4.344 4.078 3.837 6.247 5.995 5.759 5.328 4.946 4.772 4.607 4.303 4.031 6.710 6.418 6.145 5.650 5.216 5.019 4.833 4.494 4.192 7.139 6.805 6.495 5.938 5.453 5.234 7.536 7.161 6.814 6.194 5.660 5.421 7.904 7.487 7.103 6.424 5.842 5.583 8.244 7.786 7.367 6.628 6.002 5.724 8.559 8.061 7.606 6.811 6.142 5.847 14.718 13.578 12.561 11.652 10.838 10.106 9.447 8.851 8.313 7.824 6.974 6.265 5.954 15.562 14.292 13.166 12.166 11.274 10.477 9.763 9.122 8.544 8.022 7.120 6.373 6.047 16.398 14.992 13.754 12.659 11.690 10.828 10.059 9.372 8.756 8.201 7.250 6.467 6.128 5.818 5.273 4.812 17.226 15.678 14.324 13.134 12.085 11.158 10.336 9.604 8.950 8.365 7.366 6.550 6.198 5.877 5.316 4.844 18.046 16.351 14.877 13.590 12.462 11.470 10.594 9.818 9.129 8.514 7.469 6.623 6.259 5.929 5.353 4.870 7.562 6.687 6.312 5.973 5.384 4.891 5.029 4.656 4.327 5.197 4.793 4.439 5.342 4.910 4.533 5.468 5.008 4.611 5.575 5.092 4.675 5.669 5.162 4.730 5.749 5.222 4.775 18.857 17.011 15.415 14.029 12.821 11.764 10.836 10.017 9.292 8.649 sign 1. Compute this project's NPV using Eon's 16% hurdle rate. Should Eon invest in the equipment? 2. Eon could refurbish the equipment at the end of six years for $103,000. The refurbished equipment could be used one more year, providing $72,000 of net cash inflows in year 7. Additionally, the refurbished equipment would have a $53,000 residual value at the end of year 7. Should Eon invest in the equipment and refurbish it after six years? (Hint: In addition to your answer to Requirement 1, discount the additional cash outflow and inflows back to the present value.) g Eon Industries is deciding whether to automate one phase of its production process. The manufacturing equipment has a six-year life and will cost $925,000. Projected net cash inflows are as follows: (Click the icon to view the projected net cash inflows.) (Click the icon to view Present Value of $1 table.) Read the requirements Requirement 1. Compute this project's NPV using Eon's 16 % hurdle rate. Should Eon invest in the equipment? Use the following table to calculate the net present value of the project. (Enter any factor amounts to three decimal places, XXXX Use parentheses or a minus sign for a negative net present value.) Years Year 1 Year 2 Year 3 Year 4 Year 5 Present value of each year's inflow: (n = 1) Present value of each year's inflow: (n=2) Present value of each year's inflow: (n = 3) Present value of each year's inflow: (n = 4) Present value of each year's inflow: (n = 5) Year 6 Present value of each year's inflow: (n = 6) Total PV of cash inflows Year 0 Initial investment (Click the icon to view Present Value of Ordinary Annuity of $1 table.) Net present value of the project Net Cash Inflow $ 265,000 250,000 224,000 214,000 203,000 174,000 PV Factor ( = 16%) 0.862 $ 0.743 0.641 0.552 0.476 0.410 Present Value 228,430 185,750 143,584 118,128 96,628 71,340 Data table Year 1 $ Year 2 Year 3 Year 4 Year 5 Year 6 265,000 250,000 224,000 214,000 203,000 174,000 X Periods Period 1 Period 2 Period 3 Period 4 Period 5 Period 6 Period 7 Period 8 Period 9 Period 10 Period 11 Period 12 Period 13 Period 14 Period 15 Period 16 Period 17 Period 18 Period 19 Period 20 Present Value of $1 1% 2% 3% 5% 4% 6% 7% 8% 9% 10% 12% 14% 15% 16% 18% 20% 0.990 0.980 0.971 0.962 0.952 0.943 0.935 0.926 0.917 0.909 0.893 0.877 0.870 0.862 0.847 0.833 0.980 0.961 0.943 0.925 0.907 0.890 0.873 0.857 0.842 0.826 0.797 0.769 0.756 0.743 0.718 0.694 0.971 0.942 0.915 0.889 0.864 0.840 0.816 0.794 0.772 0.751 0.712 0.658 0.641 0.609 0.579 0.961 0.924 0.888 0.855 0.823 0.792 0.763 0.572 0.552 0.516 0.482 0.951 0.906 0.863 0.822 0.784 0.747 0.713 0.681 0.650 0.621 0.567 0.519 0.497 0.476 0.437 0.402 0.675 0.735 0.708 0.683 0.636 0.592 0.790 0.746 0.705 0.666 0.665 0.623 0.627 0.582 0.760 0.711 0.731 0.677 0.766 0.703 0.645 0.592 0.544 0.942 0.888 0.837 0.813 0.933 0.871 0.923 0.853 0.789 0.914 0.837 0.905 0.820 0.744 0.676 0.614 0.630 0.596 0.564 0.507 0.583 0.547 0.513 0.452 0.540 0.502 0.467 0.404 0.500 0.460 0424 0.361 0.558 0.508 0.463 0.429 0.388 0.350 0.287 0.397 0.356 0.319 0.257 0.208 0.368 0.326 0.290 0.229 0.182 0.340 0.299 0.263 0.205 0.160 0.315 0.896 0.804 0.722 0.650 0.585 0.527 0475 0.887 0.788 0.701 0.625 0.557 0.497 0.444 0.879 0.773 0.681 0.601 0.530 0.469 0.415 0.870 0.758 0.661 0.577 0.505 0.442 0.388 0.642 0.555 0.481 0.417 0.362 0.861 0.743 0.853 0.728 0.844 0.714 0.836 0.700 0.587 0.494 0.416 0.828 0.686 0.570 0.475 0.396 0.673 0.554 0.456 0.377 0.439 0.359 0.294 0242 0.623 0.534 0.458 0.394 0.339 0.605 0.513 0.436 0.371 0.317 0.350 0.296 0.331 0.277 0.312 0.258 0.820 Period 21 0.811 0.660 0.538 0.456 0.432 0410 0.370 0.335 0.400 0.376 0.354 0.314 0.279 0.351 0.327 0.305 0.266 0.233 0.308 0.284 0.263 0.225 0.194 0.422 0.386 0.322 0.270 0.247 0.227 0.191 0.162 0.237 0.215 0.195 0.162 0.135 0.187 0.168 0.137 0.112 0.163 0.145 0.116 0.093 0.141 0.125 0.099 0.078 0.275 0.239 0.183 0.140 0.123 0.108 0.084 0.065 0.292 0.252 0.218 0.163 0.123 0.107 0.093 0.071 0.054 0.270 0.231 0.198 0.146 0.108 0.093 0.080 0.060 0.045 0.250 0.212 0.180 0.130 0.095 0.081 0.069 0.051 0.038 0.232 0.194 0.164 0.116 0.083 0.070 0.060 0.043 0.031 0.215 0.178 0.149 0.104 0.073 0.061 0.051 0.037 0.026 0.199 0.164 0.135 0.093 0.064 0.053 0.044 0.031 0.022 ré ar q Periods 1% 2% Period 1 Period 2 Period 3 Period 4 Period 5 Period 6 Period 7 Period 8 Period 9 Period 10 Period 11 Period 12 Period 13 Period 14 Period 15 Period 16 Period 17 Period 18 Period 19 Period 20 Period 21 3% 0.990 0.980 0.971 1.970 1.942 1.913 2.941 2.884 2.829 3.902 3.808 3.717 4.853 4.713 4.580 Present Value of Ordinary Annuity of $1 4% 8% 9% 10% 16% 18% 20% 5% 6% 7% 12% 14% 15% 0.962 0.952 0.943 0.935 0.926 0.917 0.909 0.893 0.877 0.870 0.862 0.847 0.833 1.859 1.833 1.808 1.783 1.759 1.736 1.690 1.647 1.626 1.605 1.566 1.528 2.723 2.673 2.577 2.531 2.487 2.402 2.322 2.283 2.246 2.174 2.106 3.312 3.240 3.170 3.037 2.914 2.855 2.798 2.690 2.589 1.886 2.775 3.630 3.546 3.465 4.329 4.212 2.624 3.387 4.100 4.452 3.993 3.890 3.791 3.605 3.433 3.352 3.274 3.127 2.991 5,076 4.917 4.767 5,786 5.582 5.389 5.795 5.601 5.417 5.242 6.728 6.472 6.230 6.002 7.652 7.325 7.020 6.733 6.463 6.210 5.971 8.566 8.162 7.786 7.435 7.108 6.802 6.515 9.471 8.983 8.530 8.111 7.722 7.360 7.024 10.368 9.787 9.253 8.760 8.306 7.887 7.499 11.255 10.575 9.954 9.385 8.863 8.384 7.943 12.134 11.348 10.635 9.986 9.394 8.853 8.358 13.004 12.106 11.296 10.563 9.899 9.295 8.745 13.865 12.849 11.938 11.118 10.380 9.712 9.108 4.623 4.486 4.355 3.685 3.498 3.326 4.111 3.889 3.784 5.206 5.033 4.868 4.564 4.288 4.160 4.039 3.812 3.605 5.747 5.535 5.335 4.968 4.639 4487 4.344 4.078 3.837 6.247 5.995 5.759 5.328 4.946 4.772 4.607 4.303 4.031 6.710 6.418 6.145 5.650 5.216 5.019 4.833 4.494 4.192 7.139 6.805 6.495 5.938 5.453 5.234 7.536 7.161 6.814 6.194 5.660 5.421 7.904 7.487 7.103 6.424 5.842 5.583 8.244 7.786 7.367 6.628 6.002 5.724 8.559 8.061 7.606 6.811 6.142 5.847 14.718 13.578 12.561 11.652 10.838 10.106 9.447 8.851 8.313 7.824 6.974 6.265 5.954 15.562 14.292 13.166 12.166 11.274 10.477 9.763 9.122 8.544 8.022 7.120 6.373 6.047 16.398 14.992 13.754 12.659 11.690 10.828 10.059 9.372 8.756 8.201 7.250 6.467 6.128 5.818 5.273 4.812 17.226 15.678 14.324 13.134 12.085 11.158 10.336 9.604 8.950 8.365 7.366 6.550 6.198 5.877 5.316 4.844 18.046 16.351 14.877 13.590 12.462 11.470 10.594 9.818 9.129 8.514 7.469 6.623 6.259 5.929 5.353 4.870 7.562 6.687 6.312 5.973 5.384 4.891 5.029 4.656 4.327 5.197 4.793 4.439 5.342 4.910 4.533 5.468 5.008 4.611 5.575 5.092 4.675 5.669 5.162 4.730 5.749 5.222 4.775 18.857 17.011 15.415 14.029 12.821 11.764 10.836 10.017 9.292 8.649 sign 1. Compute this project's NPV using Eon's 16% hurdle rate. Should Eon invest in the equipment? 2. Eon could refurbish the equipment at the end of six years for $103,000. The refurbished equipment could be used one more year, providing $72,000 of net cash inflows in year 7. Additionally, the refurbished equipment would have a $53,000 residual value at the end of year 7. Should Eon invest in the equipment and refurbish it after six years? (Hint: In addition to your answer to Requirement 1, discount the additional cash outflow and inflows back to the present value.) g Eon Industries is deciding whether to automate one phase of its production process. The manufacturing equipment has a six-year life and will cost $925,000. Projected net cash inflows are as follows: (Click the icon to view the projected net cash inflows.) (Click the icon to view Present Value of $1 table.) Read the requirements Requirement 1. Compute this project's NPV using Eon's 16 % hurdle rate. Should Eon invest in the equipment? Use the following table to calculate the net present value of the project. (Enter any factor amounts to three decimal places, XXXX Use parentheses or a minus sign for a negative net present value.) Years Year 1 Year 2 Year 3 Year 4 Year 5 Present value of each year's inflow: (n = 1) Present value of each year's inflow: (n=2) Present value of each year's inflow: (n = 3) Present value of each year's inflow: (n = 4) Present value of each year's inflow: (n = 5) Year 6 Present value of each year's inflow: (n = 6) Total PV of cash inflows Year 0 Initial investment (Click the icon to view Present Value of Ordinary Annuity of $1 table.) Net present value of the project Net Cash Inflow $ 265,000 250,000 224,000 214,000 203,000 174,000 PV Factor ( = 16%) 0.862 $ 0.743 0.641 0.552 0.476 0.410 Present Value 228,430 185,750 143,584 118,128 96,628 71,340 Data table Year 1 $ Year 2 Year 3 Year 4 Year 5 Year 6 265,000 250,000 224,000 214,000 203,000 174,000 X Periods Period 1 Period 2 Period 3 Period 4 Period 5 Period 6 Period 7 Period 8 Period 9 Period 10 Period 11 Period 12 Period 13 Period 14 Period 15 Period 16 Period 17 Period 18 Period 19 Period 20 Present Value of $1 1% 2% 3% 5% 4% 6% 7% 8% 9% 10% 12% 14% 15% 16% 18% 20% 0.990 0.980 0.971 0.962 0.952 0.943 0.935 0.926 0.917 0.909 0.893 0.877 0.870 0.862 0.847 0.833 0.980 0.961 0.943 0.925 0.907 0.890 0.873 0.857 0.842 0.826 0.797 0.769 0.756 0.743 0.718 0.694 0.971 0.942 0.915 0.889 0.864 0.840 0.816 0.794 0.772 0.751 0.712 0.658 0.641 0.609 0.579 0.961 0.924 0.888 0.855 0.823 0.792 0.763 0.572 0.552 0.516 0.482 0.951 0.906 0.863 0.822 0.784 0.747 0.713 0.681 0.650 0.621 0.567 0.519 0.497 0.476 0.437 0.402 0.675 0.735 0.708 0.683 0.636 0.592 0.790 0.746 0.705 0.666 0.665 0.623 0.627 0.582 0.760 0.711 0.731 0.677 0.766 0.703 0.645 0.592 0.544 0.942 0.888 0.837 0.813 0.933 0.871 0.923 0.853 0.789 0.914 0.837 0.905 0.820 0.744 0.676 0.614 0.630 0.596 0.564 0.507 0.583 0.547 0.513 0.452 0.540 0.502 0.467 0.404 0.500 0.460 0424 0.361 0.558 0.508 0.463 0.429 0.388 0.350 0.287 0.397 0.356 0.319 0.257 0.208 0.368 0.326 0.290 0.229 0.182 0.340 0.299 0.263 0.205 0.160 0.315 0.896 0.804 0.722 0.650 0.585 0.527 0475 0.887 0.788 0.701 0.625 0.557 0.497 0.444 0.879 0.773 0.681 0.601 0.530 0.469 0.415 0.870 0.758 0.661 0.577 0.505 0.442 0.388 0.642 0.555 0.481 0.417 0.362 0.861 0.743 0.853 0.728 0.844 0.714 0.836 0.700 0.587 0.494 0.416 0.828 0.686 0.570 0.475 0.396 0.673 0.554 0.456 0.377 0.439 0.359 0.294 0242 0.623 0.534 0.458 0.394 0.339 0.605 0.513 0.436 0.371 0.317 0.350 0.296 0.331 0.277 0.312 0.258 0.820 Period 21 0.811 0.660 0.538 0.456 0.432 0410 0.370 0.335 0.400 0.376 0.354 0.314 0.279 0.351 0.327 0.305 0.266 0.233 0.308 0.284 0.263 0.225 0.194 0.422 0.386 0.322 0.270 0.247 0.227 0.191 0.162 0.237 0.215 0.195 0.162 0.135 0.187 0.168 0.137 0.112 0.163 0.145 0.116 0.093 0.141 0.125 0.099 0.078 0.275 0.239 0.183 0.140 0.123 0.108 0.084 0.065 0.292 0.252 0.218 0.163 0.123 0.107 0.093 0.071 0.054 0.270 0.231 0.198 0.146 0.108 0.093 0.080 0.060 0.045 0.250 0.212 0.180 0.130 0.095 0.081 0.069 0.051 0.038 0.232 0.194 0.164 0.116 0.083 0.070 0.060 0.043 0.031 0.215 0.178 0.149 0.104 0.073 0.061 0.051 0.037 0.026 0.199 0.164 0.135 0.093 0.064 0.053 0.044 0.031 0.022 ré ar q Periods 1% 2% Period 1 Period 2 Period 3 Period 4 Period 5 Period 6 Period 7 Period 8 Period 9 Period 10 Period 11 Period 12 Period 13 Period 14 Period 15 Period 16 Period 17 Period 18 Period 19 Period 20 Period 21 3% 0.990 0.980 0.971 1.970 1.942 1.913 2.941 2.884 2.829 3.902 3.808 3.717 4.853 4.713 4.580 Present Value of Ordinary Annuity of $1 4% 8% 9% 10% 16% 18% 20% 5% 6% 7% 12% 14% 15% 0.962 0.952 0.943 0.935 0.926 0.917 0.909 0.893 0.877 0.870 0.862 0.847 0.833 1.859 1.833 1.808 1.783 1.759 1.736 1.690 1.647 1.626 1.605 1.566 1.528 2.723 2.673 2.577 2.531 2.487 2.402 2.322 2.283 2.246 2.174 2.106 3.312 3.240 3.170 3.037 2.914 2.855 2.798 2.690 2.589 1.886 2.775 3.630 3.546 3.465 4.329 4.212 2.624 3.387 4.100 4.452 3.993 3.890 3.791 3.605 3.433 3.352 3.274 3.127 2.991 5,076 4.917 4.767 5,786 5.582 5.389 5.795 5.601 5.417 5.242 6.728 6.472 6.230 6.002 7.652 7.325 7.020 6.733 6.463 6.210 5.971 8.566 8.162 7.786 7.435 7.108 6.802 6.515 9.471 8.983 8.530 8.111 7.722 7.360 7.024 10.368 9.787 9.253 8.760 8.306 7.887 7.499 11.255 10.575 9.954 9.385 8.863 8.384 7.943 12.134 11.348 10.635 9.986 9.394 8.853 8.358 13.004 12.106 11.296 10.563 9.899 9.295 8.745 13.865 12.849 11.938 11.118 10.380 9.712 9.108 4.623 4.486 4.355 3.685 3.498 3.326 4.111 3.889 3.784 5.206 5.033 4.868 4.564 4.288 4.160 4.039 3.812 3.605 5.747 5.535 5.335 4.968 4.639 4487 4.344 4.078 3.837 6.247 5.995 5.759 5.328 4.946 4.772 4.607 4.303 4.031 6.710 6.418 6.145 5.650 5.216 5.019 4.833 4.494 4.192 7.139 6.805 6.495 5.938 5.453 5.234 7.536 7.161 6.814 6.194 5.660 5.421 7.904 7.487 7.103 6.424 5.842 5.583 8.244 7.786 7.367 6.628 6.002 5.724 8.559 8.061 7.606 6.811 6.142 5.847 14.718 13.578 12.561 11.652 10.838 10.106 9.447 8.851 8.313 7.824 6.974 6.265 5.954 15.562 14.292 13.166 12.166 11.274 10.477 9.763 9.122 8.544 8.022 7.120 6.373 6.047 16.398 14.992 13.754 12.659 11.690 10.828 10.059 9.372 8.756 8.201 7.250 6.467 6.128 5.818 5.273 4.812 17.226 15.678 14.324 13.134 12.085 11.158 10.336 9.604 8.950 8.365 7.366 6.550 6.198 5.877 5.316 4.844 18.046 16.351 14.877 13.590 12.462 11.470 10.594 9.818 9.129 8.514 7.469 6.623 6.259 5.929 5.353 4.870 7.562 6.687 6.312 5.973 5.384 4.891 5.029 4.656 4.327 5.197 4.793 4.439 5.342 4.910 4.533 5.468 5.008 4.611 5.575 5.092 4.675 5.669 5.162 4.730 5.749 5.222 4.775 18.857 17.011 15.415 14.029 12.821 11.764 10.836 10.017 9.292 8.649 sign 1. Compute this project's NPV using Eon's 16% hurdle rate. Should Eon invest in the equipment? 2. Eon could refurbish the equipment at the end of six years for $103,000. The refurbished equipment could be used one more year, providing $72,000 of net cash inflows in year 7. Additionally, the refurbished equipment would have a $53,000 residual value at the end of year 7. Should Eon invest in the equipment and refurbish it after six years? (Hint: In addition to your answer to Requirement 1, discount the additional cash outflow and inflows back to the present value.) g Eon Industries is deciding whether to automate one phase of its production process. The manufacturing equipment has a six-year life and will cost $925,000. Projected net cash inflows are as follows: (Click the icon to view the projected net cash inflows.) (Click the icon to view Present Value of $1 table.) Read the requirements Requirement 1. Compute this project's NPV using Eon's 16 % hurdle rate. Should Eon invest in the equipment? Use the following table to calculate the net present value of the project. (Enter any factor amounts to three decimal places, XXXX Use parentheses or a minus sign for a negative net present value.) Years Year 1 Year 2 Year 3 Year 4 Year 5 Present value of each year's inflow: (n = 1) Present value of each year's inflow: (n=2) Present value of each year's inflow: (n = 3) Present value of each year's inflow: (n = 4) Present value of each year's inflow: (n = 5) Year 6 Present value of each year's inflow: (n = 6) Total PV of cash inflows Year 0 Initial investment (Click the icon to view Present Value of Ordinary Annuity of $1 table.) Net present value of the project Net Cash Inflow $ 265,000 250,000 224,000 214,000 203,000 174,000 PV Factor ( = 16%) 0.862 $ 0.743 0.641 0.552 0.476 0.410 Present Value 228,430 185,750 143,584 118,128 96,628 71,340 Data table Year 1 $ Year 2 Year 3 Year 4 Year 5 Year 6 265,000 250,000 224,000 214,000 203,000 174,000 X Periods Period 1 Period 2 Period 3 Period 4 Period 5 Period 6 Period 7 Period 8 Period 9 Period 10 Period 11 Period 12 Period 13 Period 14 Period 15 Period 16 Period 17 Period 18 Period 19 Period 20 Present Value of $1 1% 2% 3% 5% 4% 6% 7% 8% 9% 10% 12% 14% 15% 16% 18% 20% 0.990 0.980 0.971 0.962 0.952 0.943 0.935 0.926 0.917 0.909 0.893 0.877 0.870 0.862 0.847 0.833 0.980 0.961 0.943 0.925 0.907 0.890 0.873 0.857 0.842 0.826 0.797 0.769 0.756 0.743 0.718 0.694 0.971 0.942 0.915 0.889 0.864 0.840 0.816 0.794 0.772 0.751 0.712 0.658 0.641 0.609 0.579 0.961 0.924 0.888 0.855 0.823 0.792 0.763 0.572 0.552 0.516 0.482 0.951 0.906 0.863 0.822 0.784 0.747 0.713 0.681 0.650 0.621 0.567 0.519 0.497 0.476 0.437 0.402 0.675 0.735 0.708 0.683 0.636 0.592 0.760 0.711 0.790 0.746 0.705 0.666 0.665 0.623 0.627 0.582 0.731 0.677 0.766 0.703 0.645 0.592 0.544 0.942 0.888 0.837 0.813 0.933 0.871 0.923 0.853 0.789 0.914 0.837 0.905 0.820 0.744 0.676 0.614 0.630 0.596 0.564 0.507 0.583 0.547 0.513 0.452 0.540 0.502 0.467 0.404 0.500 0.460 0424 0.361 0.558 0.508 0.463 0.429 0.388 0.350 0.287 0.397 0.356 0.319 0.257 0.208 0.368 0.326 0.290 0.229 0.182 0.340 0.299 0.263 0.205 0.160 0.315 0.896 0.804 0.722 0.650 0.585 0.527 0475 0.887 0.788 0.701 0.625 0.557 0.497 0.444 0.879 0.773 0.681 0.601 0.530 0.469 0.415 0.870 0.758 0.661 0.577 0.505 0.442 0.388 0.642 0.555 0.481 0.417 0.362 0.861 0.743 0.853 0.728 0.844 0.714 0.836 0.700 0.587 0.494 0.416 0.828 0.686 0.570 0.475 0.396 0.673 0.554 0.456 0.377 0.439 0.359 0.294 0242 0.623 0.534 0.458 0.394 0.339 0.605 0.513 0.436 0.371 0.317 0.350 0.296 0.331 0.277 0.312 0.258 0.820 Period 21 0.811 0.660 0.538 0.456 0.432 0410 0.370 0.335 0.400 0.376 0.354 0.314 0.279 0.351 0.327 0.305 0.266 0.233 0.308 0.284 0.263 0.225 0.194 0.422 0.386 0.322 0.270 0.247 0.227 0.191 0.162 0.237 0.215 0.195 0.162 0.135 0.187 0.168 0.137 0.112 0.163 0.145 0.116 0.093 0.141 0.125 0.099 0.078 0.275 0.239 0.183 0.140 0.123 0.108 0.084 0.065 0.292 0.252 0.218 0.163 0.123 0.107 0.093 0.071 0.054 0.270 0.231 0.198 0.146 0.108 0.093 0.080 0.060 0.045 0.250 0.212 0.180 0.130 0.095 0.081 0.069 0.051 0.038 0.232 0.194 0.164 0.116 0.083 0.070 0.060 0.043 0.031 0.215 0.178 0.149 0.104 0.073 0.061 0.051 0.037 0.026 0.199 0.164 0.135 0.093 0.064 0.053 0.044 0.031 0.022 ré ar q Periods 1% 2% Period 1 Period 2 Period 3 Period 4 Period 5 Period 6 Period 7 Period 8 Period 9 Period 10 Period 11 Period 12 Period 13 Period 14 Period 15 Period 16 Period 17 Period 18 Period 19 Period 20 Period 21 3% 0.990 0.980 0.971 1.970 1.942 1.913 2.941 2.884 2.829 3.902 3.808 3.717 4.853 4.713 4.580 Present Value of Ordinary Annuity of $1 4% 8% 9% 10% 16% 18% 20% 5% 6% 7% 12% 14% 15% 0.962 0.952 0.943 0.935 0.926 0.917 0.909 0.893 0.877 0.870 0.862 0.847 0.833 1.859 1.833 1.808 1.783 1.759 1.736 1.690 1.647 1.626 1.605 1.566 1.528 2.723 2.673 2.577 2.531 2.487 2.402 2.322 2.283 2.246 2.174 2.106 3.312 3.240 3.170 3.037 2.914 2.855 2.798 2.690 2.589 1.886 2.775 3.630 3.546 3.465 4.329 4.212 2.624 3.387 4.100 4.452 3.993 3.890 3.791 3.605 3.433 3.352 3.274 3.127 2.991 5,076 4.917 4.767 5,786 5.582 5.389 5.795 5.601 5.417 5.242 6.728 6.472 6.230 6.002 7.652 7.325 7.020 6.733 6.463 6.210 5.971 8.566 8.162 7.786 7.435 7.108 6.802 6.515 9.471 8.983 8.530 8.111 7.722 7.360 7.024 10.368 9.787 9.253 8.760 8.306 7.887 7.499 11.255 10.575 9.954 9.385 8.863 8.384 7.943 12.134 11.348 10.635 9.986 9.394 8.853 8.358 13.004 12.106 11.296 10.563 9.899 9.295 8.745 13.865 12.849 11.938 11.118 10.380 9.712 9.108 4.623 4.486 4.355 3.685 3.498 3.326 4.111 3.889 3.784 5.206 5.033 4.868 4.564 4.288 4.160 4.039 3.812 3.605 5.747 5.535 5.335 4.968 4.639 4487 4.344 4.078 3.837 6.247 5.995 5.759 5.328 4.946 4.772 4.607 4.303 4.031 6.710 6.418 6.145 5.650 5.216 5.019 4.833 4.494 4.192 7.139 6.805 6.495 5.938 5.453 5.234 7.536 7.161 6.814 6.194 5.660 5.421 7.904 7.487 7.103 6.424 5.842 5.583 8.244 7.786 7.367 6.628 6.002 5.724 8.559 8.061 7.606 6.811 6.142 5.847 14.718 13.578 12.561 11.652 10.838 10.106 9.447 8.851 8.313 7.824 6.974 6.265 5.954 15.562 14.292 13.166 12.166 11.274 10.477 9.763 9.122 8.544 8.022 7.120 6.373 6.047 16.398 14.992 13.754 12.659 11.690 10.828 10.059 9.372 8.756 8.201 7.250 6.467 6.128 5.818 5.273 4.812 17.226 15.678 14.324 13.134 12.085 11.158 10.336 9.604 8.950 8.365 7.366 6.550 6.198 5.877 5.316 4.844 18.046 16.351 14.877 13.590 12.462 11.470 10.594 9.818 9.129 8.514 7.469 6.623 6.259 5.929 5.353 4.870 7.562 6.687 6.312 5.973 5.384 4.891 5.029 4.656 4.327 5.197 4.793 4.439 5.342 4.910 4.533 5.468 5.008 4.611 5.575 5.092 4.675 5.669 5.162 4.730 5.749 5.222 4.775 18.857 17.011 15.415 14.029 12.821 11.764 10.836 10.017 9.292 8.649 sign 1. Compute this project's NPV using Eon's 16% hurdle rate. Should Eon invest in the equipment? 2. Eon could refurbish the equipment at the end of six years for $103,000. The refurbished equipment could be used one more year, providing $72,000 of net cash inflows in year 7. Additionally, the refurbished equipment would have a $53,000 residual value at the end of year 7. Should Eon invest in the equipment and refurbish it after six years? (Hint: In addition to your answer to Requirement 1, discount the additional cash outflow and inflows back to the present value.) g Eon Industries is deciding whether to automate one phase of its production process. The manufacturing equipment has a six-year life and will cost $925,000. Projected net cash inflows are as follows: (Click the icon to view the projected net cash inflows.) (Click the icon to view Present Value of $1 table.) Read the requirements Requirement 1. Compute this project's NPV using Eon's 16 % hurdle rate. Should Eon invest in the equipment? Use the following table to calculate the net present value of the project. (Enter any factor amounts to three decimal places, XXXX Use parentheses or a minus sign for a negative net present value.) Years Year 1 Year 2 Year 3 Year 4 Year 5 Present value of each year's inflow: (n = 1) Present value of each year's inflow: (n=2) Present value of each year's inflow: (n = 3) Present value of each year's inflow: (n = 4) Present value of each year's inflow: (n = 5) Year 6 Present value of each year's inflow: (n = 6) Total PV of cash inflows Year 0 Initial investment (Click the icon to view Present Value of Ordinary Annuity of $1 table.) Net present value of the project Net Cash Inflow $ 265,000 250,000 224,000 214,000 203,000 174,000 PV Factor ( = 16%) 0.862 $ 0.743 0.641 0.552 0.476 0.410 Present Value 228,430 185,750 143,584 118,128 96,628 71,340 Data table Year 1 $ Year 2 Year 3 Year 4 Year 5 Year 6 265,000 250,000 224,000 214,000 203,000 174,000 X Periods Period 1 Period 2 Period 3 Period 4 Period 5 Period 6 Period 7 Period 8 Period 9 Period 10 Period 11 Period 12 Period 13 Period 14 Period 15 Period 16 Period 17 Period 18 Period 19 Period 20 Present Value of $1 1% 2% 3% 5% 4% 6% 7% 8% 9% 10% 12% 14% 15% 16% 18% 20% 0.990 0.980 0.971 0.962 0.952 0.943 0.935 0.926 0.917 0.909 0.893 0.877 0.870 0.862 0.847 0.833 0.980 0.961 0.943 0.925 0.907 0.890 0.873 0.857 0.842 0.826 0.797 0.769 0.756 0.743 0.718 0.694 0.971 0.942 0.915 0.889 0.864 0.840 0.816 0.794 0.772 0.751 0.712 0.658 0.641 0.609 0.579 0.961 0.924 0.888 0.855 0.823 0.792 0.763 0.572 0.552 0.516 0.482 0.951 0.906 0.863 0.822 0.784 0.747 0.713 0.681 0.650 0.621 0.567 0.519 0.497 0.476 0.437 0.402 0.675 0.735 0.708 0.683 0.636 0.592 0.790 0.746 0.705 0.666 0.665 0.623 0.627 0.582 0.760 0.711 0.731 0.677 0.766 0.703 0.645 0.592 0.544 0.942 0.888 0.837 0.813 0.933 0.871 0.923 0.853 0.789 0.914 0.837 0.905 0.820 0.744 0.676 0.614 0.630 0.596 0.564 0.507 0.583 0.547 0.513 0.452 0.540 0.502 0.467 0.404 0.500 0.460 0424 0.361 0.558 0.508 0.463 0.429 0.388 0.350 0.287 0.397 0.356 0.319 0.257 0.208 0.368 0.326 0.290 0.229 0.182 0.340 0.299 0.263 0.205 0.160 0.315 0.896 0.804 0.722 0.650 0.585 0.527 0475 0.887 0.788 0.701 0.625 0.557 0.497 0.444 0.879 0.773 0.681 0.601 0.530 0.469 0.415 0.870 0.758 0.661 0.577 0.505 0.442 0.388 0.642 0.555 0.481 0.417 0.362 0.861 0.743 0.853 0.728 0.844 0.714 0.836 0.700 0.587 0.494 0.416 0.828 0.686 0.570 0.475 0.396 0.673 0.554 0.456 0.377 0.439 0.359 0.294 0242 0.623 0.534 0.458 0.394 0.339 0.605 0.513 0.436 0.371 0.317 0.350 0.296 0.331 0.277 0.312 0.258 0.820 Period 21 0.811 0.660 0.538 0.456 0.432 0410 0.370 0.335 0.400 0.376 0.354 0.314 0.279 0.351 0.327 0.305 0.266 0.233 0.308 0.284 0.263 0.225 0.194 0.422 0.386 0.322 0.270 0.247 0.227 0.191 0.162 0.237 0.215 0.195 0.162 0.135 0.187 0.168 0.137 0.112 0.163 0.145 0.116 0.093 0.141 0.125 0.099 0.078 0.275 0.239 0.183 0.140 0.123 0.108 0.084 0.065 0.292 0.252 0.218 0.163 0.123 0.107 0.093 0.071 0.054 0.270 0.231 0.198 0.146 0.108 0.093 0.080 0.060 0.045 0.250 0.212 0.180 0.130 0.095 0.081 0.069 0.051 0.038 0.232 0.194 0.164 0.116 0.083 0.070 0.060 0.043 0.031 0.215 0.178 0.149 0.104 0.073 0.061 0.051 0.037 0.026 0.199 0.164 0.135 0.093 0.064 0.053 0.044 0.031 0.022 ré ar q Periods 1% 2% Period 1 Period 2 Period 3 Period 4 Period 5 Period 6 Period 7 Period 8 Period 9 Period 10 Period 11 Period 12 Period 13 Period 14 Period 15 Period 16 Period 17 Period 18 Period 19 Period 20 Period 21 3% 0.990 0.980 0.971 1.970 1.942 1.913 2.941 2.884 2.829 3.902 3.808 3.717 4.853 4.713 4.580 Present Value of Ordinary Annuity of $1 4% 8% 9% 10% 16% 18% 20% 5% 6% 7% 12% 14% 15% 0.962 0.952 0.943 0.935 0.926 0.917 0.909 0.893 0.877 0.870 0.862 0.847 0.833 1.859 1.833 1.808 1.783 1.759 1.736 1.690 1.647 1.626 1.605 1.566 1.528 2.723 2.673 2.577 2.531 2.487 2.402 2.322 2.283 2.246 2.174 2.106 3.312 3.240 3.170 3.037 2.914 2.855 2.798 2.690 2.589 1.886 2.775 3.630 3.546 3.465 4.329 4.212 2.624 3.387 4.100 4.452 3.993 3.890 3.791 3.605 3.433 3.352 3.274 3.127 2.991 5,076 4.917 4.767 5,786 5.582 5.389 5.795 5.601 5.417 5.242 6.728 6.472 6.230 6.002 7.652 7.325 7.020 6.733 6.463 6.210 5.971 8.566 8.162 7.786 7.435 7.108 6.802 6.515 9.471 8.983 8.530 8.111 7.722 7.360 7.024 10.368 9.787 9.253 8.760 8.306 7.887 7.499 11.255 10.575 9.954 9.385 8.863 8.384 7.943 12.134 11.348 10.635 9.986 9.394 8.853 8.358 13.004 12.106 11.296 10.563 9.899 9.295 8.745 13.865 12.849 11.938 11.118 10.380 9.712 9.108 4.623 4.486 4.355 3.685 3.498 3.326 4.111 3.889 3.784 5.206 5.033 4.868 4.564 4.288 4.160 4.039 3.812 3.605 5.747 5.535 5.335 4.968 4.639 4487 4.344 4.078 3.837 6.247 5.995 5.759 5.328 4.946 4.772 4.607 4.303 4.031 6.710 6.418 6.145 5.650 5.216 5.019 4.833 4.494 4.192 7.139 6.805 6.495 5.938 5.453 5.234 7.536 7.161 6.814 6.194 5.660 5.421 7.904 7.487 7.103 6.424 5.842 5.583 8.244 7.786 7.367 6.628 6.002 5.724 8.559 8.061 7.606 6.811 6.142 5.847 14.718 13.578 12.561 11.652 10.838 10.106 9.447 8.851 8.313 7.824 6.974 6.265 5.954 15.562 14.292 13.166 12.166 11.274 10.477 9.763 9.122 8.544 8.022 7.120 6.373 6.047 16.398 14.992 13.754 12.659 11.690 10.828 10.059 9.372 8.756 8.201 7.250 6.467 6.128 5.818 5.273 4.812 17.226 15.678 14.324 13.134 12.085 11.158 10.336 9.604 8.950 8.365 7.366 6.550 6.198 5.877 5.316 4.844 18.046 16.351 14.877 13.590 12.462 11.470 10.594 9.818 9.129 8.514 7.469 6.623 6.259 5.929 5.353 4.870 7.562 6.687 6.312 5.973 5.384 4.891 5.029 4.656 4.327 5.197 4.793 4.439 5.342 4.910 4.533 5.468 5.008 4.611 5.575 5.092 4.675 5.669 5.162 4.730 5.749 5.222 4.775 18.857 17.011 15.415 14.029 12.821 11.764 10.836 10.017 9.292 8.649 sign 1. Compute this project's NPV using Eon's 16% hurdle rate. Should Eon invest in the equipment? 2. Eon could refurbish the equipment at the end of six years for $103,000. The refurbished equipment could be used one more year, providing $72,000 of net cash inflows in year 7. Additionally, the refurbished equipment would have a $53,000 residual value at the end of year 7. Should Eon invest in the equipment and refurbish it after six years? (Hint: In addition to your answer to Requirement 1, discount the additional cash outflow and inflows back to the present value.) g Eon Industries is deciding whether to automate one phase of its production process. The manufacturing equipment has a six-year life and will cost $925,000. Projected net cash inflows are as follows: (Click the icon to view the projected net cash inflows.) (Click the icon to view Present Value of $1 table.) Read the requirements Requirement 1. Compute this project's NPV using Eon's 16 % hurdle rate. Should Eon invest in the equipment? Use the following table to calculate the net present value of the project. (Enter any factor amounts to three decimal places, XXXX Use parentheses or a minus sign for a negative net present value.) Years Year 1 Year 2 Year 3 Year 4 Year 5 Present value of each year's inflow: (n = 1) Present value of each year's inflow: (n=2) Present value of each year's inflow: (n = 3) Present value of each year's inflow: (n = 4) Present value of each year's inflow: (n = 5) Year 6 Present value of each year's inflow: (n = 6) Total PV of cash inflows Year 0 Initial investment (Click the icon to view Present Value of Ordinary Annuity of $1 table.) Net present value of the project Net Cash Inflow $ 265,000 250,000 224,000 214,000 203,000 174,000 PV Factor ( = 16%) 0.862 $ 0.743 0.641 0.552 0.476 0.410 Present Value 228,430 185,750 143,584 118,128 96,628 71,340 Data table Year 1 $ Year 2 Year 3 Year 4 Year 5 Year 6 265,000 250,000 224,000 214,000 203,000 174,000 X Periods Period 1 Period 2 Period 3 Period 4 Period 5 Period 6 Period 7 Period 8 Period 9 Period 10 Period 11 Period 12 Period 13 Period 14 Period 15 Period 16 Period 17 Period 18 Period 19 Period 20 Present Value of $1 1% 2% 3% 5% 4% 6% 7% 8% 9% 10% 12% 14% 15% 16% 18% 20% 0.990 0.980 0.971 0.962 0.952 0.943 0.935 0.926 0.917 0.909 0.893 0.877 0.870 0.862 0.847 0.833 0.980 0.961 0.943 0.925 0.907 0.890 0.873 0.857 0.842 0.826 0.797 0.769 0.756 0.743 0.718 0.694 0.971 0.942 0.915 0.889 0.864 0.840 0.816 0.794 0.772 0.751 0.712 0.658 0.641 0.609 0.579 0.961 0.924 0.888 0.855 0.823 0.792 0.763 0.572 0.552 0.516 0.482 0.951 0.906 0.863 0.822 0.784 0.747 0.713 0.681 0.650 0.621 0.567 0.519 0.497 0.476 0.437 0.402 0.675 0.735 0.708 0.683 0.636 0.592 0.790 0.746 0.705 0.666 0.665 0.623 0.627 0.582 0.760 0.711 0.731 0.677 0.766 0.703 0.645 0.592 0.544 0.942 0.888 0.837 0.813 0.933 0.871 0.923 0.853 0.789 0.914 0.837 0.905 0.820 0.744 0.676 0.614 0.630 0.596 0.564 0.507 0.583 0.547 0.513 0.452 0.540 0.502 0.467 0.404 0.500 0.460 0424 0.361 0.558 0.508 0.463 0.429 0.388 0.350 0.287 0.397 0.356 0.319 0.257 0.208 0.368 0.326 0.290 0.229 0.182 0.340 0.299 0.263 0.205 0.160 0.315 0.896 0.804 0.722 0.650 0.585 0.527 0475 0.887 0.788 0.701 0.625 0.557 0.497 0.444 0.879 0.773 0.681 0.601 0.530 0.469 0.415 0.870 0.758 0.661 0.577 0.505 0.442 0.388 0.642 0.555 0.481 0.417 0.362 0.861 0.743 0.853 0.728 0.844 0.714 0.836 0.700 0.587 0.494 0.416 0.828 0.686 0.570 0.475 0.396 0.673 0.554 0.456 0.377 0.439 0.359 0.294 0242 0.623 0.534 0.458 0.394 0.339 0.605 0.513 0.436 0.371 0.317 0.350 0.296 0.331 0.277 0.312 0.258 0.820 Period 21 0.811 0.660 0.538 0.456 0.432 0410 0.370 0.335 0.400 0.376 0.354 0.314 0.279 0.351 0.327 0.305 0.266 0.233 0.308 0.284 0.263 0.225 0.194 0.422 0.386 0.322 0.270 0.247 0.227 0.191 0.162 0.237 0.215 0.195 0.162 0.135 0.187 0.168 0.137 0.112 0.163 0.145 0.116 0.093 0.141 0.125 0.099 0.078 0.275 0.239 0.183 0.140 0.123 0.108 0.084 0.065 0.292 0.252 0.218 0.163 0.123 0.107 0.093 0.071 0.054 0.270 0.231 0.198 0.146 0.108 0.093 0.080 0.060 0.045 0.250 0.212 0.180 0.130 0.095 0.081 0.069 0.051 0.038 0.232 0.194 0.164 0.116 0.083 0.070 0.060 0.043 0.031 0.215 0.178 0.149 0.104 0.073 0.061 0.051 0.037 0.026 0.199 0.164 0.135 0.093 0.064 0.053 0.044 0.031 0.022 ré ar q Periods 1% 2% Period 1 Period 2 Period 3 Period 4 Period 5 Period 6 Period 7 Period 8 Period 9 Period 10 Period 11 Period 12 Period 13 Period 14 Period 15 Period 16 Period 17 Period 18 Period 19 Period 20 Period 21 3% 0.990 0.980 0.971 1.970 1.942 1.913 2.941 2.884 2.829 3.902 3.808 3.717 4.853 4.713 4.580 Present Value of Ordinary Annuity of $1 4% 8% 9% 10% 16% 18% 20% 5% 6% 7% 12% 14% 15% 0.962 0.952 0.943 0.935 0.926 0.917 0.909 0.893 0.877 0.870 0.862 0.847 0.833 1.859 1.833 1.808 1.783 1.759 1.736 1.690 1.647 1.626 1.605 1.566 1.528 2.723 2.673 2.577 2.531 2.487 2.402 2.322 2.283 2.246 2.174 2.106 3.312 3.240 3.170 3.037 2.914 2.855 2.798 2.690 2.589 1.886 2.775 3.630 3.546 3.465 4.329 4.212 2.624 3.387 4.100 4.452 3.993 3.890 3.791 3.605 3.433 3.352 3.274 3.127 2.991 5,076 4.917 4.767 5,786 5.582 5.389 5.795 5.601 5.417 5.242 6.728 6.472 6.230 6.002 7.652 7.325 7.020 6.733 6.463 6.210 5.971 8.566 8.162 7.786 7.435 7.108 6.802 6.515 9.471 8.983 8.530 8.111 7.722 7.360 7.024 10.368 9.787 9.253 8.760 8.306 7.887 7.499 11.255 10.575 9.954 9.385 8.863 8.384 7.943 12.134 11.348 10.635 9.986 9.394 8.853 8.358 13.004 12.106 11.296 10.563 9.899 9.295 8.745 13.865 12.849 11.938 11.118 10.380 9.712 9.108 4.623 4.486 4.355 3.685 3.498 3.326 4.111 3.889 3.784 5.206 5.033 4.868 4.564 4.288 4.160 4.039 3.812 3.605 5.747 5.535 5.335 4.968 4.639 4487 4.344 4.078 3.837 6.247 5.995 5.759 5.328 4.946 4.772 4.607 4.303 4.031 6.710 6.418 6.145 5.650 5.216 5.019 4.833 4.494 4.192 7.139 6.805 6.495 5.938 5.453 5.234 7.536 7.161 6.814 6.194 5.660 5.421 7.904 7.487 7.103 6.424 5.842 5.583 8.244 7.786 7.367 6.628 6.002 5.724 8.559 8.061 7.606 6.811 6.142 5.847 14.718 13.578 12.561 11.652 10.838 10.106 9.447 8.851 8.313 7.824 6.974 6.265 5.954 15.562 14.292 13.166 12.166 11.274 10.477 9.763 9.122 8.544 8.022 7.120 6.373 6.047 16.398 14.992 13.754 12.659 11.690 10.828 10.059 9.372 8.756 8.201 7.250 6.467 6.128 5.818 5.273 4.812 17.226 15.678 14.324 13.134 12.085 11.158 10.336 9.604 8.950 8.365 7.366 6.550 6.198 5.877 5.316 4.844 18.046 16.351 14.877 13.590 12.462 11.470 10.594 9.818 9.129 8.514 7.469 6.623 6.259 5.929 5.353 4.870 7.562 6.687 6.312 5.973 5.384 4.891 5.029 4.656 4.327 5.197 4.793 4.439 5.342 4.910 4.533 5.468 5.008 4.611 5.575 5.092 4.675 5.669 5.162 4.730 5.749 5.222 4.775 18.857 17.011 15.415 14.029 12.821 11.764 10.836 10.017 9.292 8.649 sign 1. Compute this project's NPV using Eon's 16% hurdle rate. Should Eon invest in the equipment? 2. Eon could refurbish the equipment at the end of six years for $103,000. The refurbished equipment could be used one more year, providing $72,000 of net cash inflows in year 7. Additionally, the refurbished equipment would have a $53,000 residual value at the end of year 7. Should Eon invest in the equipment and refurbish it after six years? (Hint: In addition to your answer to Requirement 1, discount the additional cash outflow and inflows back to the present value.)
Expert Answer:
Answer rating: 100% (QA)
Requirement 1 Years Net Cash Inflow PV Factor i16 1 n1 265000 0862 2 n2 250000 ... View the full answer

Related Book For 
Horngrens Financial and Managerial Accounting
ISBN: 978-0133866292
5th edition
Authors: Tracie L. Nobles, Brenda L. Mattison, Ella Mae Matsumura
Posted Date:
Students also viewed these mathematics questions
-
Eon Industries is deciding whether to automate one phase of its production process. The manufacturing equipment has a six-year life and will cost $920,000. Projected net cash inflows are as follows:...
-
Kerwin Industries is deciding whether to automate one phase of its production process. The manufacturing equipment has a six-year life and will cost $905,000. Projected net cash inflows are as...
-
Christina is trying to save money in her bank account. She decides that she can deposit $1000 each month into the account. The account earns 2.3% interest each month. How much money will be in the...
-
Nikolas Boat Company makes inexpensive aluminum fishing boats. Production is seasonal, with considerable activity occurring in the spring and summer. Sales and production tend to decline in the fall...
-
When atndrte2 and ACT. atndrte are added to the equation estimated in (6.19), the R-squared becomes .232. Are these additional terms jointly significant at the 10% level? Would you include them in...
-
Why might deep green environmentalists favour the presentation of corporate information in ecological accounts but reject disclosures in environmentally adjusted financial accounts?
-
Part A The common stock of Wilson, Inc. is owned by 20 stockholders who live in several states. Wilsons financial statements as of December 31, 1994 were audited by Doe & Co., CPAs, who rendered an...
-
Identified Two goals are: THINKER and Connector Thinkers tend to excel when they like their work and can think through all angles and contingencies. They can appear to be combative, critical and...
-
Calculate some of the standard customer acquisition costs across different types of channels: (conversion rate means the percentage of people who purchased the item among all the people who watched...
-
I want to make a site like a photo. However, in order to do so, I think I have to create style.css. However, I don't know how to make it. Please let me know what style.css I should write. Rubia M....
-
An intoxicated driver recklessly drove his vehicle into a car being driven by a woman who was seven months pregnant. As a result of the accident, the womans baby was born prematurely, suffered from...
-
To what extent is the English common law significant in contemporary American criminal law?
-
Several college freshmen enter the deans private office and remain there for several hours. They refuse to let the dean leave until he yields to their demands to allow unrestricted visitation in all...
-
What limitations do courts impose on police in the use of deception in interrogations of suspects?
-
A store manager observes Lucy Grabit stuffing a pair of nylon hose into her purse before going through the checkout counter in a supermarket. The manager detains her and promptly directs his employee...
-
Write Source code and Output. Attached are the Questions. Bitcoin For HW project (3) we are going to make a baby bitcoin program that lets us keep track of buying and selling bitcoin with a menu. You...
-
We all experience emotions, but some people disguise their true feelings better than others. Do you think this is a helpful or harmful thing to do? Under what conditions do you think it would be most...
-
Refer to Exercise El 9-23. The president of Southern suspects that her allocation of indirect costs could be giving misleading results, so she decides to develop an ABC system. She identifies three...
-
Journalize the following sales transactions for Double Z Archery using the periodic inventory system. Explanations are not required. Aug. 1 Sold $7,800 of equipment on account, credit terms are 2/10,...
-
Park and Fly, near an airport, incurred the following costs to acquire land, make land improvements, and construct and furnish a small building: Park and Fly depreciates land improvements over 20...
-
The transient part of the solution arises from a. forcing function b. initial conditions c. bounding conditions
-
Fill in the Blank. The response of a linear system under any periodic force can be found by ___________ appropriate harmonic responses.
-
Find the steady-state response of the hydraulic control valve shown in Fig. 4.4 (a) to the forcing functions obtained by replacing \(x(t)\) with \(F(t)\) and \(A\) with \(F_{0}\) in Figs. 1.115....

Study smarter with the SolutionInn App