

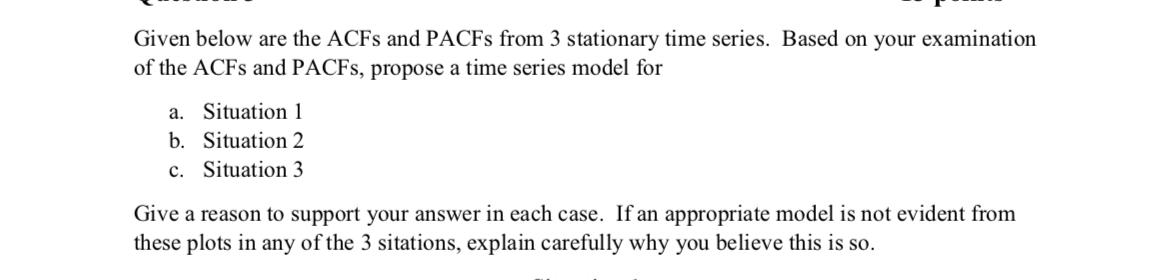
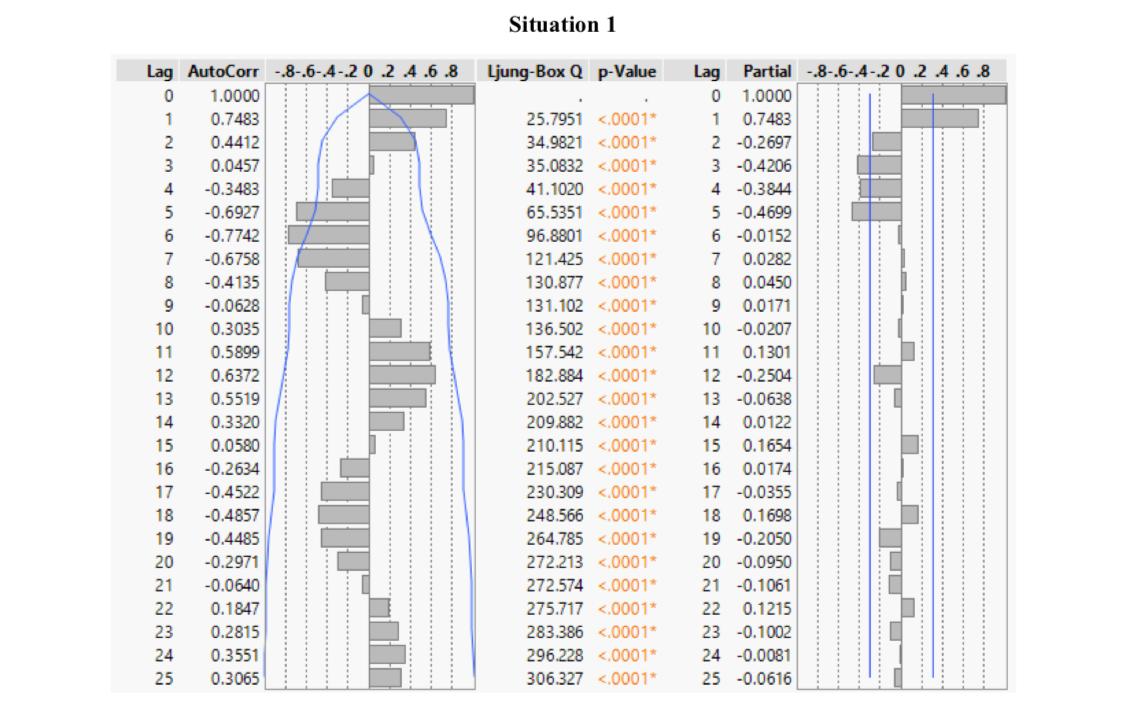
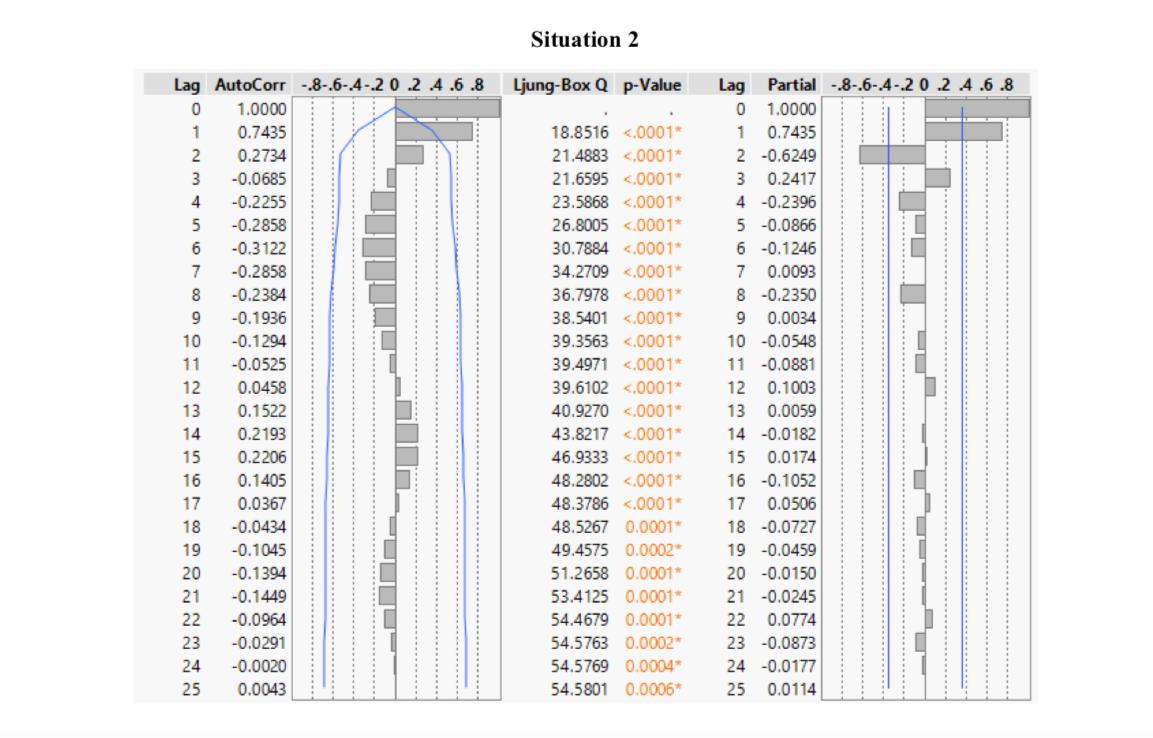
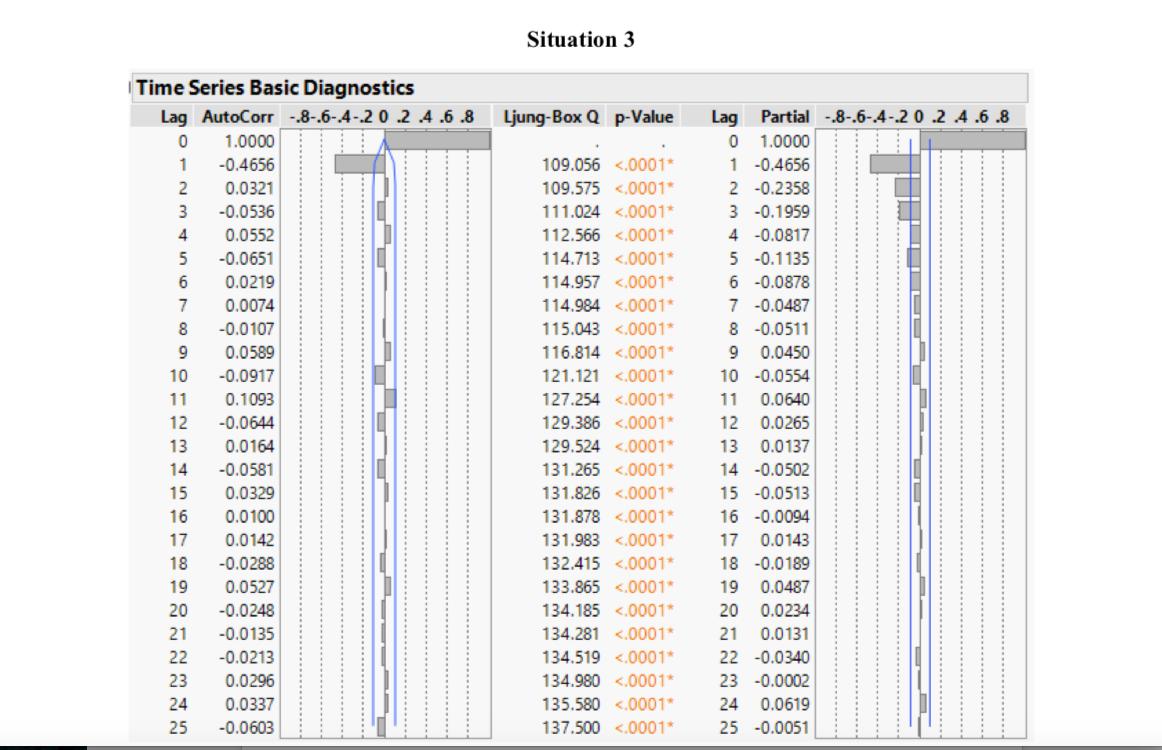
Given below are the ACFS and PACFS from 3 stationary time series. Based on your examination...
Fantastic news! We've Found the answer you've been seeking!
Question:
Transcribed Image Text:
Given below are the ACFS and PACFS from 3 stationary time series. Based on your examination of the ACFS and PACFS, propose a time series model for a. Situation 1 b. Situation 2 c. Situation 3 Give a reason to support your answer in each case. If an appropriate model is not evident from these plots in any of the 3 sitations, explain carefully why you believe this is so. Situation 1 Lag AutoCorr -.8-.6-4-.2 0.2 .4 .6 .8 Ljung-Box Q p-Value Partial -.8-.6-4-2 0 .2 4 .6 .8 Lag 0 1.0000 1 0.7483 2 -0.2697 3 -0.4206 1.0000 0.7483 25.7951 <.0001* 0.4412 34.9821 <.0001* 3 0.0457 35.0832 <.0001* 4 -0.3483 41.1020 <.0001* 4 -0.3844 5 -0.4699 6 -0.0152 7 0.0282 8 0.0450 9 0.0171 5 -0.6927 65.5351 <.0001* 6 -0.7742 96.8801 <.0001* 7 -0.6758 121.425 <.0001* 8 -0.4135 130.877 <.0001* 9 -0.0628 131.102 <.0001* 10 0.3035 136.502 <.0001* 10 -0.0207 11 0.5899 157.542 <.0001* 11 0.1301 12 0.6372 182.884 <.0001* 12 -0.2504 13 0.5519 202.527 <.0001* 13 -0.0638 14 0.3320 209.882 <.0001* 14 0.0122 15 0.0580 210.115 <.0001* 15 0.1654 16 -0.2634 215.087 <.0001* 16 0.0174 17 -0.4522 230.309 <.0001* 17 -0.0355 18 -0.4857 248.566 <.0001* 18 0.1698 19 -0.4485 264.785 <.0001* 19 -0.2050 20 -0.2971 272.213 <.0001* 20 -0.0950 21 -0.0640 272.574 <.0001* 21 -0.1061 22 0.1847 275.717 <.0001* 22 0.1215 23 0.2815 283.386 <.0001* 23 -0.1002 24 0.3551 296.228 <.0001* 24 -0.0081 25 0.3065 306.327 <.0001* 25 -0.0616 Situation 2 Lag AutoCorr -.8-.6-4-2 0.2 4.6 .8 Ljung-Box Q p-Value Lag Partial -8-.6-4-20 .2 4.6 .8 1.0000 0 1.0000 0.7435 18.8516 <.0001* 1 0.7435 2 0.2734 21.4883 <.0001* 2 -0.6249 -0.0685 21.6595 <.0001* 3 0.2417 -0.2255 23.5868 <.0001* 4 -0.2396 5 -0.0866 6 -0.1246 5 -0.2858 26.8005 <.0001* 6 -0.3122 30.7884 <.0001* 7 -0.2858 34.2709 <.0001* 7 0.0093 8 -0.2384 36.7978 <.0001* 8 -0.2350 -0.1936 38.5401 <.0001* 0.0034 10 -0.1294 39.3563 <.0001* 10 -0.0548 11 -0.0525 39.4971 <.0001* 11 -0.0881 12 0.0458 39.6102 <.0001* 12 0.1003 13 0.1522 40.9270 <.0001" 13 0.0059 14 0.2193 43.8217 <.0001* 14 -0.0182 15 0.2206 46.9333 <.0001* 15 0.0174 16 0.1405 48.2802 <.0001* 16 -0.1052 17 0.0367 48.3786 <.0001* 17 0.0506 18 -0.0434 48.5267 0.0001* 18 -0.0727 19 -0.1045 49.4575 0.0002 19 -0.0459 20 -0.1394 51.2658 0.0001* 20 -0.0150 21 -0.1449 53.4125 0.0001* 21 -0.0245 22 -0.0964 54.4679 0.0001* 22 0.0774 23 -0.0291 54.5763 0.0002* 23 -0.0873 24 -0.0020 54.5769 0.0004* 24 -0.0177 25 0.0043 54.5801 0.0006* 25 0.0114 Situation 3 Time Series Basic Diagnostics Lag AutoCorr -.8-.6-4-.2 0 .2 .4 .6 .8 Ljung-Box Q p-Value Lag Partial -.8-.6-4-.2 0 .2 4 .6 .8 1.0000 1.0000 -0.4656 109.056 <.0001* 1 -0.4656 0.0321 109.575 <.0001* 2 -0.2358 -0.0536 111.024 <.0001* 3 -0.1959 4 0.0552 112.566 <.0001* 4 -0.0817 5 -0.1135 6 -0.0878 7 -0.0487 8 -0.0511 -0.0651 114.713 <.0001* 6 0.0219 114.957 <.0001* 7 0.0074 114.984 <.0001* 8 -0.0107 115.043 <.0001* 9. 0.0589 116.814 <.0001* 0.0450 10 -0.0917 121.121 <.0001* 10 -0.0554 11 0.1093 127.254 <.0001* 11 0.0640 12 -0.0644 129.386 <.0001* 12 0.0265 13 0.0164 129.524 <.0001* 13 0.0137 14 -0.0581 131.265 <.0001* 14 -0.0502 15 0.0329 131.826 <.0001* 15 -0.0513 16 0.0100 131.878 <.0001* 16 -0.0094 17 0.0142 131.983 <.0001* 17 0.0143 18 -0.0288 132.415 <.0001* 18 -0.0189 19 0.0527 133.865 <.0001* 19 0.0487 20 -0.0248 134.185 <.0001* 20 0.0234 21 -0.0135 134.281 <.0001* 21 0.0131 22 -0.0213 134.519 <.0001* 22 -0.0340 23 0.0296 134.980 <.0001* 23 -0.0002 24 0.0337 135.580 <.0001* 24 0.0619 25 -0.0603 137.500 <.0001* 25 -0.0051 Given below are the ACFS and PACFS from 3 stationary time series. Based on your examination of the ACFS and PACFS, propose a time series model for a. Situation 1 b. Situation 2 c. Situation 3 Give a reason to support your answer in each case. If an appropriate model is not evident from these plots in any of the 3 sitations, explain carefully why you believe this is so. Situation 1 Lag AutoCorr -.8-.6-4-.2 0.2 .4 .6 .8 Ljung-Box Q p-Value Partial -.8-.6-4-2 0 .2 4 .6 .8 Lag 0 1.0000 1 0.7483 2 -0.2697 3 -0.4206 1.0000 0.7483 25.7951 <.0001* 0.4412 34.9821 <.0001* 3 0.0457 35.0832 <.0001* 4 -0.3483 41.1020 <.0001* 4 -0.3844 5 -0.4699 6 -0.0152 7 0.0282 8 0.0450 9 0.0171 5 -0.6927 65.5351 <.0001* 6 -0.7742 96.8801 <.0001* 7 -0.6758 121.425 <.0001* 8 -0.4135 130.877 <.0001* 9 -0.0628 131.102 <.0001* 10 0.3035 136.502 <.0001* 10 -0.0207 11 0.5899 157.542 <.0001* 11 0.1301 12 0.6372 182.884 <.0001* 12 -0.2504 13 0.5519 202.527 <.0001* 13 -0.0638 14 0.3320 209.882 <.0001* 14 0.0122 15 0.0580 210.115 <.0001* 15 0.1654 16 -0.2634 215.087 <.0001* 16 0.0174 17 -0.4522 230.309 <.0001* 17 -0.0355 18 -0.4857 248.566 <.0001* 18 0.1698 19 -0.4485 264.785 <.0001* 19 -0.2050 20 -0.2971 272.213 <.0001* 20 -0.0950 21 -0.0640 272.574 <.0001* 21 -0.1061 22 0.1847 275.717 <.0001* 22 0.1215 23 0.2815 283.386 <.0001* 23 -0.1002 24 0.3551 296.228 <.0001* 24 -0.0081 25 0.3065 306.327 <.0001* 25 -0.0616 Situation 2 Lag AutoCorr -.8-.6-4-2 0.2 4.6 .8 Ljung-Box Q p-Value Lag Partial -8-.6-4-20 .2 4.6 .8 1.0000 0 1.0000 0.7435 18.8516 <.0001* 1 0.7435 2 0.2734 21.4883 <.0001* 2 -0.6249 -0.0685 21.6595 <.0001* 3 0.2417 -0.2255 23.5868 <.0001* 4 -0.2396 5 -0.0866 6 -0.1246 5 -0.2858 26.8005 <.0001* 6 -0.3122 30.7884 <.0001* 7 -0.2858 34.2709 <.0001* 7 0.0093 8 -0.2384 36.7978 <.0001* 8 -0.2350 -0.1936 38.5401 <.0001* 0.0034 10 -0.1294 39.3563 <.0001* 10 -0.0548 11 -0.0525 39.4971 <.0001* 11 -0.0881 12 0.0458 39.6102 <.0001* 12 0.1003 13 0.1522 40.9270 <.0001" 13 0.0059 14 0.2193 43.8217 <.0001* 14 -0.0182 15 0.2206 46.9333 <.0001* 15 0.0174 16 0.1405 48.2802 <.0001* 16 -0.1052 17 0.0367 48.3786 <.0001* 17 0.0506 18 -0.0434 48.5267 0.0001* 18 -0.0727 19 -0.1045 49.4575 0.0002 19 -0.0459 20 -0.1394 51.2658 0.0001* 20 -0.0150 21 -0.1449 53.4125 0.0001* 21 -0.0245 22 -0.0964 54.4679 0.0001* 22 0.0774 23 -0.0291 54.5763 0.0002* 23 -0.0873 24 -0.0020 54.5769 0.0004* 24 -0.0177 25 0.0043 54.5801 0.0006* 25 0.0114 Situation 3 Time Series Basic Diagnostics Lag AutoCorr -.8-.6-4-.2 0 .2 .4 .6 .8 Ljung-Box Q p-Value Lag Partial -.8-.6-4-.2 0 .2 4 .6 .8 1.0000 1.0000 -0.4656 109.056 <.0001* 1 -0.4656 0.0321 109.575 <.0001* 2 -0.2358 -0.0536 111.024 <.0001* 3 -0.1959 4 0.0552 112.566 <.0001* 4 -0.0817 5 -0.1135 6 -0.0878 7 -0.0487 8 -0.0511 -0.0651 114.713 <.0001* 6 0.0219 114.957 <.0001* 7 0.0074 114.984 <.0001* 8 -0.0107 115.043 <.0001* 9. 0.0589 116.814 <.0001* 0.0450 10 -0.0917 121.121 <.0001* 10 -0.0554 11 0.1093 127.254 <.0001* 11 0.0640 12 -0.0644 129.386 <.0001* 12 0.0265 13 0.0164 129.524 <.0001* 13 0.0137 14 -0.0581 131.265 <.0001* 14 -0.0502 15 0.0329 131.826 <.0001* 15 -0.0513 16 0.0100 131.878 <.0001* 16 -0.0094 17 0.0142 131.983 <.0001* 17 0.0143 18 -0.0288 132.415 <.0001* 18 -0.0189 19 0.0527 133.865 <.0001* 19 0.0487 20 -0.0248 134.185 <.0001* 20 0.0234 21 -0.0135 134.281 <.0001* 21 0.0131 22 -0.0213 134.519 <.0001* 22 -0.0340 23 0.0296 134.980 <.0001* 23 -0.0002 24 0.0337 135.580 <.0001* 24 0.0619 25 -0.0603 137.500 <.0001* 25 -0.0051
Expert Answer:
Answer rating: 100% (QA)
a Its Timeseries Data it has below characteristics 1 Trend 2 Season... View the full answer

Related Book For 

Statistics The Exploration & Analysis of Data
ISBN: 978-1133164135
7th edition
Authors: Roxy Peck, Jay L. Devore
Posted Date:
Students also viewed these accounting questions
-
Given below are the systolic blood pressure measurements (mm Hg) and blood platelet counts (1000 cells/?L) of the first few subjects included in Data Set 1 ?Body Data? in Appendix B. Construct a...
-
Given below are the sodium contents (in mg) for seven brands of hot dogs rated as very good by Consumer Reports (www.consumerreports.org): a. Use the given data to produce a point estimate of m, the...
-
Given below are the frequencies observed from 320 tosses of a die. Do these data cast doubt on the fairness of the die? Face No, 2 3 4 5 6 Total Frequency 39 63 56 67 57 38 320
-
List the fish and invertebrates you selected after the nitrogen cycling process?
-
Draw payoff diagrams for each of the following portfolios (X = strike price): a. Buy a call with X = $50, and sell a call with X = $60 b. Buy a bond with a face value of $10, short a put with X =...
-
Divide into two groups and prepare arguments for and against the following behavior: In the case of Dr. Jeffrey Wigand and the Brown & Williamson Tobacco Company, the CBS Broadcasting Company chose...
-
The average time that Americans commute to work is 27.7 minutes (Sterlings Best Places). The average commute times in minutes for 48 cities follows. a. What is the mean commute time for these 48...
-
The following expenditures relating to plant assets were made by Devereaux Company during the first 2 months of 2014. 1. Paid $5,000 of accrued taxes at time plant site was acquired. 2. Paid $400...
-
For the year ended December 31, 2024, Fidelity Engineering reported pretax accounting income of $1,036,000. Selected information for 2024 from Fidelity's records follows: Interest income on municipal...
-
Hot & Cold and CaldoFreddo are two European manufacturers of home appliances that have merged. Hot & Cold has plants in France, Germany, and Finland, whereas CaldoFreddo has plants in the...
-
Choose a date and time to sell your remaining five stocks that you previously purchased and calculate the capital gain or loss, the tax implications, and the dividends to be included in income....
-
A box contains three orange balls and two purple balls, and two are selected at random. What is the probability of the second ball being orange if we know that the first draw was orange and we draw...
-
Suppose a test for cancer is given. If a person has cancer, the test will detect it in \(96 \%\) of the cases; if the person does not have cancer, the test will show a positive result \(1 \%\) of the...
-
The probability that an individual who is selected at random from a population has blue eyes has been estimated to be 0.35 . Find the probability that at least one of four people selected at random...
-
What is the probability that if a pair of dice is rolled six times, exactly one sum of seven is rolled?
-
Suppose a test for hypoglycemia is given. If a person has hypoglycemia, the test will detect it in \(90 \%\) of the cases; if the person does not have hypoglycemia, the test will show a positive...
-
"X" Textiles , based in a medium-sized town in South Germany, is a medium-sized, family-run German company making high-priced casual clothing such as T-Shirts and jogging pants. All items are made in...
-
The test statistic in the NeymanPearson Lemma and the likelihood ratio test statistic K are intimately related. Consider testing H 0 : = 0 versus H a : = a , and let * denote the test statistic...
-
The accompanying frequency distribution summarizes data on the number of times smokers who had successfully quit smoking attempted to quit before their final successful attempt (Demographic...
-
Classify each of the following variables as either categorical or numerical. For those that are numerical, determine whether they are discrete or continuous. a. Number of students in a class of 35...
-
The U.S. Department of Transportation reported the number of speeding-related crash fatalities for the 20 days of the year that had the highest number of these fatalities between 1994 and 2003...
-
Analyze the transient problem with the Dirichlet condition for a long cylinder and for a sphere. Derive expressions for the eigenfunctions, eigenconditions, and eigenvalues. Find the series...
-
Consider the problem of transient heat transfer with a constant heat source in a slab. Show that the governing equation in dimensionless form is \[\begin{equation*}\frac{\partial \theta}{\partial...
-
Eigenvalues without pain: CHEBFUN code. Eigenfunctions can be derived using the CHEBFUN with MATLAB since it has an overloaded eig function. The following code solves for the eigenfunctions of the...

Study smarter with the SolutionInn App