

Given the histogram, where the x-axis represents the number of years employees worked for the Department of
Fantastic news! We've Found the answer you've been seeking!
Question:
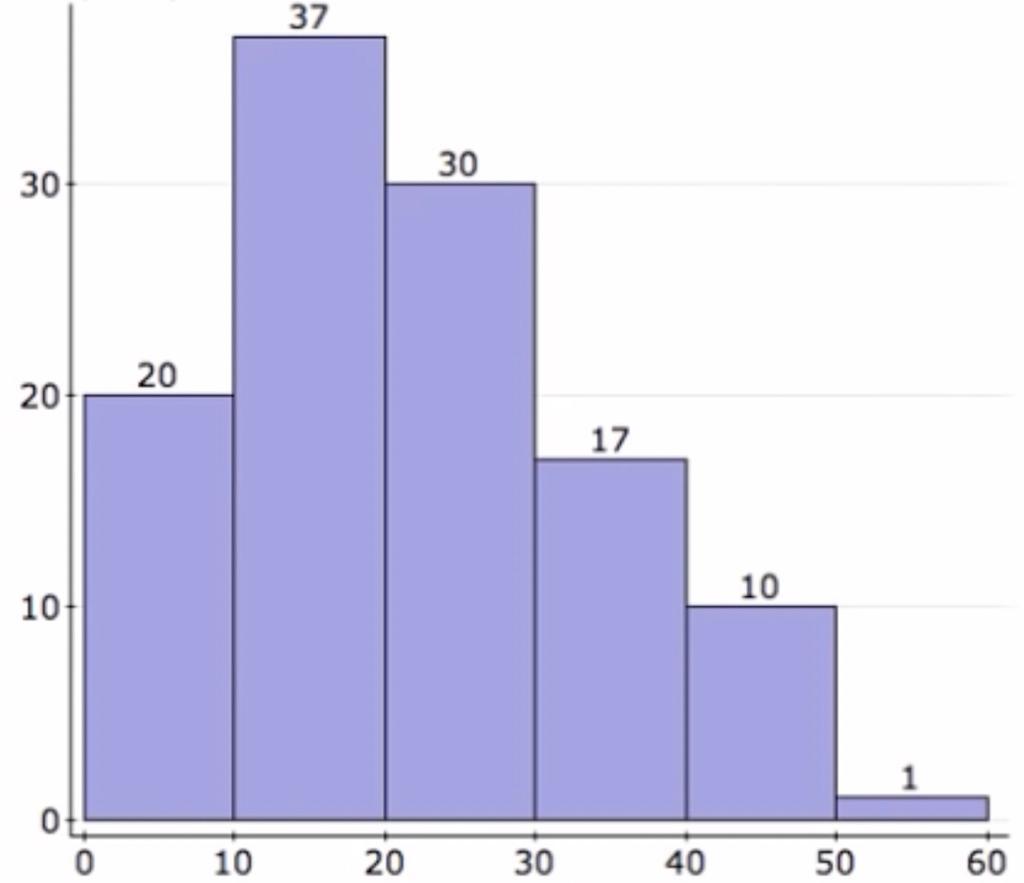
Given the histogram, where the x-axis represents the number of years employees worked for the Department of Defense and the y-axis represents the frequencies. What percentage of those surveyed worked longer then 30 years? (Note the lower and upper limit for the first class is 0, 9 respectively.)
A. 17%
B. 24%
C. 28%
D. 87%
E. None of the above are correct.
Expert Answer:
Here given that a histogram x axis represent the number of years employees worked for th... View the full answer

Related Book For 

Data Analysis and Decision Making
ISBN: 978-0538476126
4th edition
Authors: Christian Albright, Wayne Winston, Christopher Zappe
Posted Date:
