

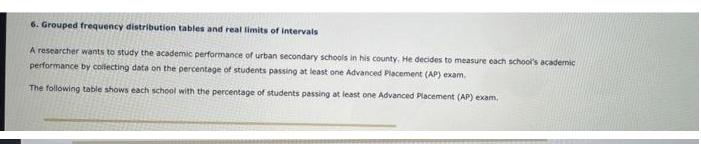
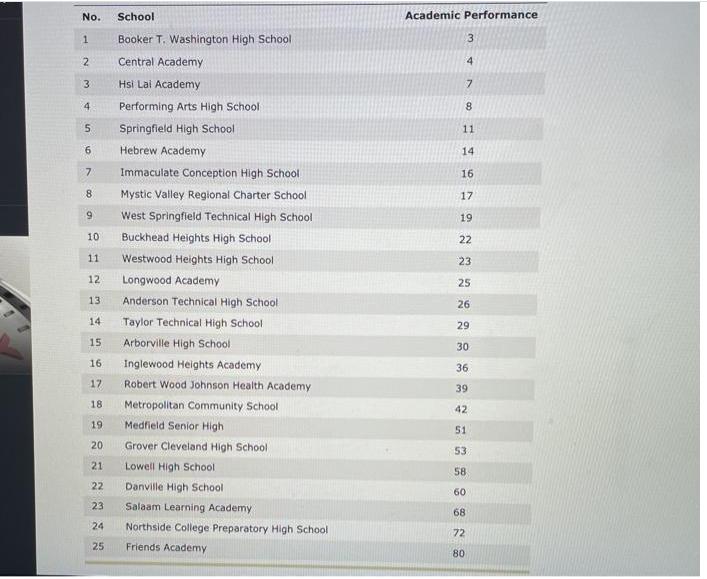
Grouped frequency distribution tables and real limits of intervals A researcher wants to study the academic...
Fantastic news! We've Found the answer you've been seeking!
Question:
Expert Answer:

Related Book For 

Statistics The Art And Science Of Learning From Data
ISBN: 9780321755940
3rd Edition
Authors: Alan Agresti, Christine A. Franklin
Posted Date:
