

Brock's administration is thinking about implementing a policy of coed floors only in dormitories. Currently there...
Fantastic news! We've Found the answer you've been seeking!
Question:
Transcribed Image Text:
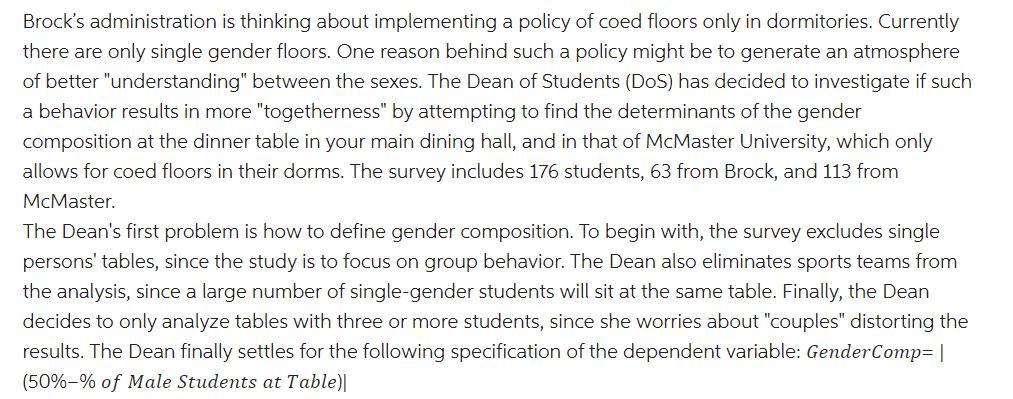
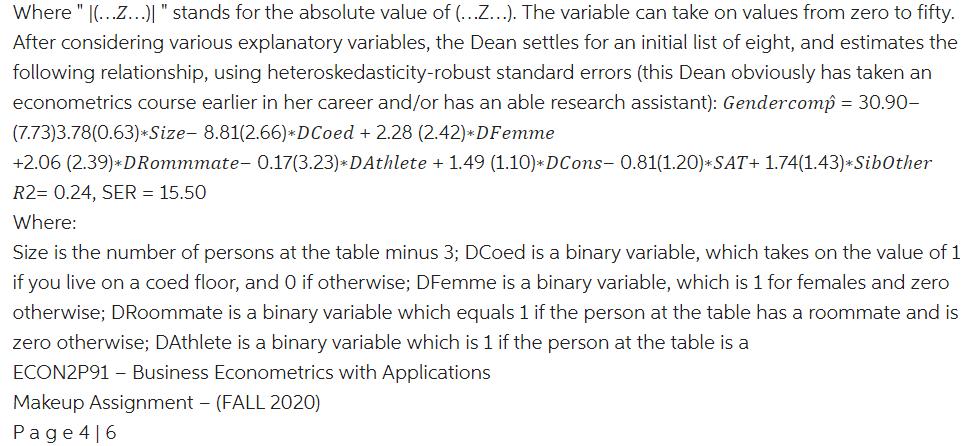
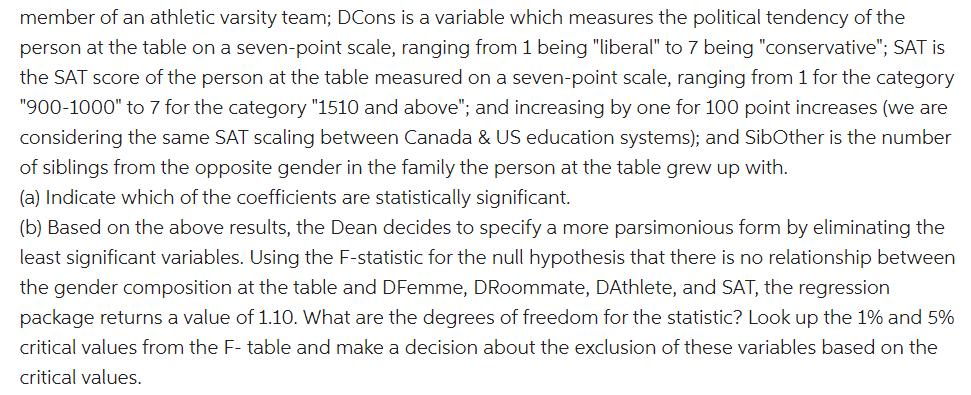
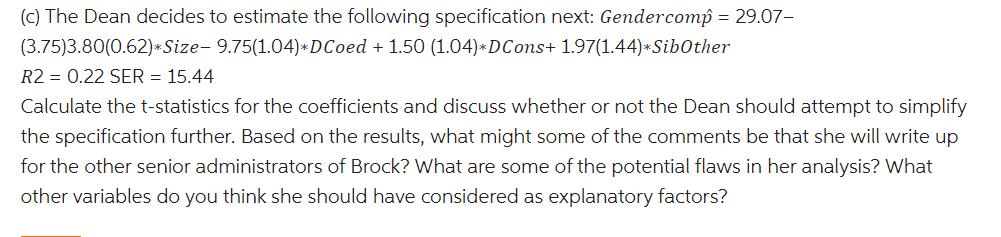
Brock's administration is thinking about implementing a policy of coed floors only in dormitories. Currently there are only single gender floors. One reason behind such a policy might be to generate an atmosphere of better "understanding" between the sexes. The Dean of Students (DoS) has decided to investigate if such a behavior results in more "togetherness" by attempting to find the determinants of the gender composition at the dinner table in your main dining hall, and in that of McMaster University, which only allows for coed floors in their dorms. The survey includes 176 students, 63 from Brock, and 113 from McMaster. The Dean's first problem is how to define gender composition. To begin with, the survey excludes single persons' tables, since the study is to focus on group behavior. The Dean also eliminates sports teams from the analysis, since a large number of single-gender students will sit at the same table. Finally, the Dean decides to only analyze tables with three or more students, since she worries about "couples" distorting the results. The Dean finally settles for the following specification of the dependent variable: GenderComp= | (50%-% of Male Students at Table)| Where " |(...z...)| " stands for the absolute value of (...Z...). The variable can take on values from zero to fifty. After considering various explanatory variables, the Dean settles for an initial list of eight, and estimates the following relationship, using heteroskedasticity-robust standard errors (this Dean obviously has taken an econometrics course earlier in her career and/or has an able research assistant): Gendercomp = 30.90- (7.73)3.78(0.63)*Size- 8.81(2.66)*DCoed + 2.28 (2.42)*DFemme +2.06 (2.39)*DRommmate- 0.17(3.23)*DAthlete + 1.49 (1.10)* DCons- 0.81(1.20)*SAT+ 1.74(1.43)*SibOther R2= 0.24, SER = 15.50 Where: Size is the number of persons at the table minus 3; DCoed is a binary variable, which takes on the value of 1 if you live on a coed floor, and 0 if otherwise; DFemme is a binary variable, which is 1 for females and zero otherwise; DRoommate is a binary variable which equals 1 if the person at the table has a roommate and is zero otherwise; DAthlete is a binary variable which is 1 if the person at the table is a ECON2P91 - Business Econometrics with Applications Makeup Assignment - (FALL 2020) Page 4|6 member of an athletic varsity team; DCons is a variable which measures the political tendency of the person at the table on a seven-point scale, ranging from 1 being "liberal" to 7 being "conservative"; SAT is the SAT score of the person at the table measured on a seven-point scale, ranging from 1 for the category "900-1000" to 7 for the category "1510 and above"; and increasing by one for 100 point increases (we are considering the same SAT scaling between Canada & US education systems); and SibOther is the number of siblings from the opposite gender in the family the person at the table grew up with. (a) Indicate which of the coefficients are statistically significant. (b) Based on the above results, the Dean decides to specify a more parsimonious form by eliminating the least significant variables. Using the F-statistic for the null hypothesis that there is no relationship between the gender composition at the table and DFemme, DRoommate, DAthlete, and SAT, the regression package returns a value of 1.10. What are the degrees of freedom for the statistic? Look up the 1% and 5% critical values from the F- table and make a decision about the exclusion of these variables based on the critical values. (c) The Dean decides to estimate the following specification next: Gendercomp = 29.07- (3.75)3.80(0.62)*Size- 9.75(1.04)*DCoed + 1.50 (1.04)*DCons+ 1.97(1.44)*SibOther R2 = 0.22 SER = 15.44 Calculate the t-statistics for the coefficients and discuss whether or not the Dean should attempt to simplify the specification further. Based on the results, what might some of the comments be that she will write up for the other senior administrators of Brock? What are some of the potential flaws in her analysis? What other variables do you think she should have considered as explanatory factors? Brock's administration is thinking about implementing a policy of coed floors only in dormitories. Currently there are only single gender floors. One reason behind such a policy might be to generate an atmosphere of better "understanding" between the sexes. The Dean of Students (DoS) has decided to investigate if such a behavior results in more "togetherness" by attempting to find the determinants of the gender composition at the dinner table in your main dining hall, and in that of McMaster University, which only allows for coed floors in their dorms. The survey includes 176 students, 63 from Brock, and 113 from McMaster. The Dean's first problem is how to define gender composition. To begin with, the survey excludes single persons' tables, since the study is to focus on group behavior. The Dean also eliminates sports teams from the analysis, since a large number of single-gender students will sit at the same table. Finally, the Dean decides to only analyze tables with three or more students, since she worries about "couples" distorting the results. The Dean finally settles for the following specification of the dependent variable: GenderComp= | (50%-% of Male Students at Table)| Where " |(...z...)| " stands for the absolute value of (...Z...). The variable can take on values from zero to fifty. After considering various explanatory variables, the Dean settles for an initial list of eight, and estimates the following relationship, using heteroskedasticity-robust standard errors (this Dean obviously has taken an econometrics course earlier in her career and/or has an able research assistant): Gendercomp = 30.90- (7.73)3.78(0.63)*Size- 8.81(2.66)*DCoed + 2.28 (2.42)*DFemme +2.06 (2.39)*DRommmate- 0.17(3.23)*DAthlete + 1.49 (1.10)* DCons- 0.81(1.20)*SAT+ 1.74(1.43)*SibOther R2= 0.24, SER = 15.50 Where: Size is the number of persons at the table minus 3; DCoed is a binary variable, which takes on the value of 1 if you live on a coed floor, and 0 if otherwise; DFemme is a binary variable, which is 1 for females and zero otherwise; DRoommate is a binary variable which equals 1 if the person at the table has a roommate and is zero otherwise; DAthlete is a binary variable which is 1 if the person at the table is a ECON2P91 - Business Econometrics with Applications Makeup Assignment - (FALL 2020) Page 4|6 member of an athletic varsity team; DCons is a variable which measures the political tendency of the person at the table on a seven-point scale, ranging from 1 being "liberal" to 7 being "conservative"; SAT is the SAT score of the person at the table measured on a seven-point scale, ranging from 1 for the category "900-1000" to 7 for the category "1510 and above"; and increasing by one for 100 point increases (we are considering the same SAT scaling between Canada & US education systems); and SibOther is the number of siblings from the opposite gender in the family the person at the table grew up with. (a) Indicate which of the coefficients are statistically significant. (b) Based on the above results, the Dean decides to specify a more parsimonious form by eliminating the least significant variables. Using the F-statistic for the null hypothesis that there is no relationship between the gender composition at the table and DFemme, DRoommate, DAthlete, and SAT, the regression package returns a value of 1.10. What are the degrees of freedom for the statistic? Look up the 1% and 5% critical values from the F- table and make a decision about the exclusion of these variables based on the critical values. (c) The Dean decides to estimate the following specification next: Gendercomp = 29.07- (3.75)3.80(0.62)*Size- 9.75(1.04)*DCoed + 1.50 (1.04)*DCons+ 1.97(1.44)*SibOther R2 = 0.22 SER = 15.44 Calculate the t-statistics for the coefficients and discuss whether or not the Dean should attempt to simplify the specification further. Based on the results, what might some of the comments be that she will write up for the other senior administrators of Brock? What are some of the potential flaws in her analysis? What other variables do you think she should have considered as explanatory factors? Brock's administration is thinking about implementing a policy of coed floors only in dormitories. Currently there are only single gender floors. One reason behind such a policy might be to generate an atmosphere of better "understanding" between the sexes. The Dean of Students (DoS) has decided to investigate if such a behavior results in more "togetherness" by attempting to find the determinants of the gender composition at the dinner table in your main dining hall, and in that of McMaster University, which only allows for coed floors in their dorms. The survey includes 176 students, 63 from Brock, and 113 from McMaster. The Dean's first problem is how to define gender composition. To begin with, the survey excludes single persons' tables, since the study is to focus on group behavior. The Dean also eliminates sports teams from the analysis, since a large number of single-gender students will sit at the same table. Finally, the Dean decides to only analyze tables with three or more students, since she worries about "couples" distorting the results. The Dean finally settles for the following specification of the dependent variable: GenderComp= | (50%-% of Male Students at Table)| Where " |(...z...)| " stands for the absolute value of (...Z...). The variable can take on values from zero to fifty. After considering various explanatory variables, the Dean settles for an initial list of eight, and estimates the following relationship, using heteroskedasticity-robust standard errors (this Dean obviously has taken an econometrics course earlier in her career and/or has an able research assistant): Gendercomp = 30.90- (7.73)3.78(0.63)*Size- 8.81(2.66)*DCoed + 2.28 (2.42)*DFemme +2.06 (2.39)*DRommmate- 0.17(3.23)*DAthlete + 1.49 (1.10)* DCons- 0.81(1.20)*SAT+ 1.74(1.43)*SibOther R2= 0.24, SER = 15.50 Where: Size is the number of persons at the table minus 3; DCoed is a binary variable, which takes on the value of 1 if you live on a coed floor, and 0 if otherwise; DFemme is a binary variable, which is 1 for females and zero otherwise; DRoommate is a binary variable which equals 1 if the person at the table has a roommate and is zero otherwise; DAthlete is a binary variable which is 1 if the person at the table is a ECON2P91 - Business Econometrics with Applications Makeup Assignment - (FALL 2020) Page 4|6 member of an athletic varsity team; DCons is a variable which measures the political tendency of the person at the table on a seven-point scale, ranging from 1 being "liberal" to 7 being "conservative"; SAT is the SAT score of the person at the table measured on a seven-point scale, ranging from 1 for the category "900-1000" to 7 for the category "1510 and above"; and increasing by one for 100 point increases (we are considering the same SAT scaling between Canada & US education systems); and SibOther is the number of siblings from the opposite gender in the family the person at the table grew up with. (a) Indicate which of the coefficients are statistically significant. (b) Based on the above results, the Dean decides to specify a more parsimonious form by eliminating the least significant variables. Using the F-statistic for the null hypothesis that there is no relationship between the gender composition at the table and DFemme, DRoommate, DAthlete, and SAT, the regression package returns a value of 1.10. What are the degrees of freedom for the statistic? Look up the 1% and 5% critical values from the F- table and make a decision about the exclusion of these variables based on the critical values. (c) The Dean decides to estimate the following specification next: Gendercomp = 29.07- (3.75)3.80(0.62)*Size- 9.75(1.04)*DCoed + 1.50 (1.04)*DCons+ 1.97(1.44)*SibOther R2 = 0.22 SER = 15.44 Calculate the t-statistics for the coefficients and discuss whether or not the Dean should attempt to simplify the specification further. Based on the results, what might some of the comments be that she will write up for the other senior administrators of Brock? What are some of the potential flaws in her analysis? What other variables do you think she should have considered as explanatory factors? Brock's administration is thinking about implementing a policy of coed floors only in dormitories. Currently there are only single gender floors. One reason behind such a policy might be to generate an atmosphere of better "understanding" between the sexes. The Dean of Students (DoS) has decided to investigate if such a behavior results in more "togetherness" by attempting to find the determinants of the gender composition at the dinner table in your main dining hall, and in that of McMaster University, which only allows for coed floors in their dorms. The survey includes 176 students, 63 from Brock, and 113 from McMaster. The Dean's first problem is how to define gender composition. To begin with, the survey excludes single persons' tables, since the study is to focus on group behavior. The Dean also eliminates sports teams from the analysis, since a large number of single-gender students will sit at the same table. Finally, the Dean decides to only analyze tables with three or more students, since she worries about "couples" distorting the results. The Dean finally settles for the following specification of the dependent variable: GenderComp= | (50%-% of Male Students at Table)| Where " |(...z...)| " stands for the absolute value of (...Z...). The variable can take on values from zero to fifty. After considering various explanatory variables, the Dean settles for an initial list of eight, and estimates the following relationship, using heteroskedasticity-robust standard errors (this Dean obviously has taken an econometrics course earlier in her career and/or has an able research assistant): Gendercomp = 30.90- (7.73)3.78(0.63)*Size- 8.81(2.66)*DCoed + 2.28 (2.42)*DFemme +2.06 (2.39)*DRommmate- 0.17(3.23)*DAthlete + 1.49 (1.10)* DCons- 0.81(1.20)*SAT+ 1.74(1.43)*SibOther R2= 0.24, SER = 15.50 Where: Size is the number of persons at the table minus 3; DCoed is a binary variable, which takes on the value of 1 if you live on a coed floor, and 0 if otherwise; DFemme is a binary variable, which is 1 for females and zero otherwise; DRoommate is a binary variable which equals 1 if the person at the table has a roommate and is zero otherwise; DAthlete is a binary variable which is 1 if the person at the table is a ECON2P91 - Business Econometrics with Applications Makeup Assignment - (FALL 2020) Page 4|6 member of an athletic varsity team; DCons is a variable which measures the political tendency of the person at the table on a seven-point scale, ranging from 1 being "liberal" to 7 being "conservative"; SAT is the SAT score of the person at the table measured on a seven-point scale, ranging from 1 for the category "900-1000" to 7 for the category "1510 and above"; and increasing by one for 100 point increases (we are considering the same SAT scaling between Canada & US education systems); and SibOther is the number of siblings from the opposite gender in the family the person at the table grew up with. (a) Indicate which of the coefficients are statistically significant. (b) Based on the above results, the Dean decides to specify a more parsimonious form by eliminating the least significant variables. Using the F-statistic for the null hypothesis that there is no relationship between the gender composition at the table and DFemme, DRoommate, DAthlete, and SAT, the regression package returns a value of 1.10. What are the degrees of freedom for the statistic? Look up the 1% and 5% critical values from the F- table and make a decision about the exclusion of these variables based on the critical values. (c) The Dean decides to estimate the following specification next: Gendercomp = 29.07- (3.75)3.80(0.62)*Size- 9.75(1.04)*DCoed + 1.50 (1.04)*DCons+ 1.97(1.44)*SibOther R2 = 0.22 SER = 15.44 Calculate the t-statistics for the coefficients and discuss whether or not the Dean should attempt to simplify the specification further. Based on the results, what might some of the comments be that she will write up for the other senior administrators of Brock? What are some of the potential flaws in her analysis? What other variables do you think she should have considered as explanatory factors? Brock's administration is thinking about implementing a policy of coed floors only in dormitories. Currently there are only single gender floors. One reason behind such a policy might be to generate an atmosphere of better "understanding" between the sexes. The Dean of Students (DoS) has decided to investigate if such a behavior results in more "togetherness" by attempting to find the determinants of the gender composition at the dinner table in your main dining hall, and in that of McMaster University, which only allows for coed floors in their dorms. The survey includes 176 students, 63 from Brock, and 113 from McMaster. The Dean's first problem is how to define gender composition. To begin with, the survey excludes single persons' tables, since the study is to focus on group behavior. The Dean also eliminates sports teams from the analysis, since a large number of single-gender students will sit at the same table. Finally, the Dean decides to only analyze tables with three or more students, since she worries about "couples" distorting the results. The Dean finally settles for the following specification of the dependent variable: GenderComp= | (50%-% of Male Students at Table)| Where " |(...z...)| " stands for the absolute value of (...Z...). The variable can take on values from zero to fifty. After considering various explanatory variables, the Dean settles for an initial list of eight, and estimates the following relationship, using heteroskedasticity-robust standard errors (this Dean obviously has taken an econometrics course earlier in her career and/or has an able research assistant): Gendercomp = 30.90- (7.73)3.78(0.63)*Size- 8.81(2.66)*DCoed + 2.28 (2.42)*DFemme +2.06 (2.39)*DRommmate- 0.17(3.23)*DAthlete + 1.49 (1.10)* DCons- 0.81(1.20)*SAT+ 1.74(1.43)*SibOther R2= 0.24, SER = 15.50 Where: Size is the number of persons at the table minus 3; DCoed is a binary variable, which takes on the value of 1 if you live on a coed floor, and 0 if otherwise; DFemme is a binary variable, which is 1 for females and zero otherwise; DRoommate is a binary variable which equals 1 if the person at the table has a roommate and is zero otherwise; DAthlete is a binary variable which is 1 if the person at the table is a ECON2P91 - Business Econometrics with Applications Makeup Assignment - (FALL 2020) Page 4|6 member of an athletic varsity team; DCons is a variable which measures the political tendency of the person at the table on a seven-point scale, ranging from 1 being "liberal" to 7 being "conservative"; SAT is the SAT score of the person at the table measured on a seven-point scale, ranging from 1 for the category "900-1000" to 7 for the category "1510 and above"; and increasing by one for 100 point increases (we are considering the same SAT scaling between Canada & US education systems); and SibOther is the number of siblings from the opposite gender in the family the person at the table grew up with. (a) Indicate which of the coefficients are statistically significant. (b) Based on the above results, the Dean decides to specify a more parsimonious form by eliminating the least significant variables. Using the F-statistic for the null hypothesis that there is no relationship between the gender composition at the table and DFemme, DRoommate, DAthlete, and SAT, the regression package returns a value of 1.10. What are the degrees of freedom for the statistic? Look up the 1% and 5% critical values from the F- table and make a decision about the exclusion of these variables based on the critical values. (c) The Dean decides to estimate the following specification next: Gendercomp = 29.07- (3.75)3.80(0.62)*Size- 9.75(1.04)*DCoed + 1.50 (1.04)*DCons+ 1.97(1.44)*SibOther R2 = 0.22 SER = 15.44 Calculate the t-statistics for the coefficients and discuss whether or not the Dean should attempt to simplify the specification further. Based on the results, what might some of the comments be that she will write up for the other senior administrators of Brock? What are some of the potential flaws in her analysis? What other variables do you think she should have considered as explanatory factors? Brock's administration is thinking about implementing a policy of coed floors only in dormitories. Currently there are only single gender floors. One reason behind such a policy might be to generate an atmosphere of better "understanding" between the sexes. The Dean of Students (DoS) has decided to investigate if such a behavior results in more "togetherness" by attempting to find the determinants of the gender composition at the dinner table in your main dining hall, and in that of McMaster University, which only allows for coed floors in their dorms. The survey includes 176 students, 63 from Brock, and 113 from McMaster. The Dean's first problem is how to define gender composition. To begin with, the survey excludes single persons' tables, since the study is to focus on group behavior. The Dean also eliminates sports teams from the analysis, since a large number of single-gender students will sit at the same table. Finally, the Dean decides to only analyze tables with three or more students, since she worries about "couples" distorting the results. The Dean finally settles for the following specification of the dependent variable: GenderComp= | (50%-% of Male Students at Table)| Where " |(...z...)| " stands for the absolute value of (...Z...). The variable can take on values from zero to fifty. After considering various explanatory variables, the Dean settles for an initial list of eight, and estimates the following relationship, using heteroskedasticity-robust standard errors (this Dean obviously has taken an econometrics course earlier in her career and/or has an able research assistant): Gendercomp = 30.90- (7.73)3.78(0.63)*Size- 8.81(2.66)*DCoed + 2.28 (2.42)*DFemme +2.06 (2.39)*DRommmate- 0.17(3.23)*DAthlete + 1.49 (1.10)* DCons- 0.81(1.20)*SAT+ 1.74(1.43)*SibOther R2= 0.24, SER = 15.50 Where: Size is the number of persons at the table minus 3; DCoed is a binary variable, which takes on the value of 1 if you live on a coed floor, and 0 if otherwise; DFemme is a binary variable, which is 1 for females and zero otherwise; DRoommate is a binary variable which equals 1 if the person at the table has a roommate and is zero otherwise; DAthlete is a binary variable which is 1 if the person at the table is a ECON2P91 - Business Econometrics with Applications Makeup Assignment - (FALL 2020) Page 4|6 member of an athletic varsity team; DCons is a variable which measures the political tendency of the person at the table on a seven-point scale, ranging from 1 being "liberal" to 7 being "conservative"; SAT is the SAT score of the person at the table measured on a seven-point scale, ranging from 1 for the category "900-1000" to 7 for the category "1510 and above"; and increasing by one for 100 point increases (we are considering the same SAT scaling between Canada & US education systems); and SibOther is the number of siblings from the opposite gender in the family the person at the table grew up with. (a) Indicate which of the coefficients are statistically significant. (b) Based on the above results, the Dean decides to specify a more parsimonious form by eliminating the least significant variables. Using the F-statistic for the null hypothesis that there is no relationship between the gender composition at the table and DFemme, DRoommate, DAthlete, and SAT, the regression package returns a value of 1.10. What are the degrees of freedom for the statistic? Look up the 1% and 5% critical values from the F- table and make a decision about the exclusion of these variables based on the critical values. (c) The Dean decides to estimate the following specification next: Gendercomp = 29.07- (3.75)3.80(0.62)*Size- 9.75(1.04)*DCoed + 1.50 (1.04)*DCons+ 1.97(1.44)*SibOther R2 = 0.22 SER = 15.44 Calculate the t-statistics for the coefficients and discuss whether or not the Dean should attempt to simplify the specification further. Based on the results, what might some of the comments be that she will write up for the other senior administrators of Brock? What are some of the potential flaws in her analysis? What other variables do you think she should have considered as explanatory factors? Brock's administration is thinking about implementing a policy of coed floors only in dormitories. Currently there are only single gender floors. One reason behind such a policy might be to generate an atmosphere of better "understanding" between the sexes. The Dean of Students (DoS) has decided to investigate if such a behavior results in more "togetherness" by attempting to find the determinants of the gender composition at the dinner table in your main dining hall, and in that of McMaster University, which only allows for coed floors in their dorms. The survey includes 176 students, 63 from Brock, and 113 from McMaster. The Dean's first problem is how to define gender composition. To begin with, the survey excludes single persons' tables, since the study is to focus on group behavior. The Dean also eliminates sports teams from the analysis, since a large number of single-gender students will sit at the same table. Finally, the Dean decides to only analyze tables with three or more students, since she worries about "couples" distorting the results. The Dean finally settles for the following specification of the dependent variable: GenderComp= | (50%-% of Male Students at Table)| Where " |(...z...)| " stands for the absolute value of (...Z...). The variable can take on values from zero to fifty. After considering various explanatory variables, the Dean settles for an initial list of eight, and estimates the following relationship, using heteroskedasticity-robust standard errors (this Dean obviously has taken an econometrics course earlier in her career and/or has an able research assistant): Gendercomp = 30.90- (7.73)3.78(0.63)*Size- 8.81(2.66)*DCoed + 2.28 (2.42)*DFemme +2.06 (2.39)*DRommmate- 0.17(3.23)*DAthlete + 1.49 (1.10)* DCons- 0.81(1.20)*SAT+ 1.74(1.43)*SibOther R2= 0.24, SER = 15.50 Where: Size is the number of persons at the table minus 3; DCoed is a binary variable, which takes on the value of 1 if you live on a coed floor, and 0 if otherwise; DFemme is a binary variable, which is 1 for females and zero otherwise; DRoommate is a binary variable which equals 1 if the person at the table has a roommate and is zero otherwise; DAthlete is a binary variable which is 1 if the person at the table is a ECON2P91 - Business Econometrics with Applications Makeup Assignment - (FALL 2020) Page 4|6 member of an athletic varsity team; DCons is a variable which measures the political tendency of the person at the table on a seven-point scale, ranging from 1 being "liberal" to 7 being "conservative"; SAT is the SAT score of the person at the table measured on a seven-point scale, ranging from 1 for the category "900-1000" to 7 for the category "1510 and above"; and increasing by one for 100 point increases (we are considering the same SAT scaling between Canada & US education systems); and SibOther is the number of siblings from the opposite gender in the family the person at the table grew up with. (a) Indicate which of the coefficients are statistically significant. (b) Based on the above results, the Dean decides to specify a more parsimonious form by eliminating the least significant variables. Using the F-statistic for the null hypothesis that there is no relationship between the gender composition at the table and DFemme, DRoommate, DAthlete, and SAT, the regression package returns a value of 1.10. What are the degrees of freedom for the statistic? Look up the 1% and 5% critical values from the F- table and make a decision about the exclusion of these variables based on the critical values. (c) The Dean decides to estimate the following specification next: Gendercomp = 29.07- (3.75)3.80(0.62)*Size- 9.75(1.04)*DCoed + 1.50 (1.04)*DCons+ 1.97(1.44)*SibOther R2 = 0.22 SER = 15.44 Calculate the t-statistics for the coefficients and discuss whether or not the Dean should attempt to simplify the specification further. Based on the results, what might some of the comments be that she will write up for the other senior administrators of Brock? What are some of the potential flaws in her analysis? What other variables do you think she should have considered as explanatory factors? Brock's administration is thinking about implementing a policy of coed floors only in dormitories. Currently there are only single gender floors. One reason behind such a policy might be to generate an atmosphere of better "understanding" between the sexes. The Dean of Students (DoS) has decided to investigate if such a behavior results in more "togetherness" by attempting to find the determinants of the gender composition at the dinner table in your main dining hall, and in that of McMaster University, which only allows for coed floors in their dorms. The survey includes 176 students, 63 from Brock, and 113 from McMaster. The Dean's first problem is how to define gender composition. To begin with, the survey excludes single persons' tables, since the study is to focus on group behavior. The Dean also eliminates sports teams from the analysis, since a large number of single-gender students will sit at the same table. Finally, the Dean decides to only analyze tables with three or more students, since she worries about "couples" distorting the results. The Dean finally settles for the following specification of the dependent variable: GenderComp= | (50%-% of Male Students at Table)| Where " |(...z...)| " stands for the absolute value of (...Z...). The variable can take on values from zero to fifty. After considering various explanatory variables, the Dean settles for an initial list of eight, and estimates the following relationship, using heteroskedasticity-robust standard errors (this Dean obviously has taken an econometrics course earlier in her career and/or has an able research assistant): Gendercomp = 30.90- (7.73)3.78(0.63)*Size- 8.81(2.66)*DCoed + 2.28 (2.42)*DFemme +2.06 (2.39)*DRommmate- 0.17(3.23)*DAthlete + 1.49 (1.10)* DCons- 0.81(1.20)*SAT+ 1.74(1.43)*SibOther R2= 0.24, SER = 15.50 Where: Size is the number of persons at the table minus 3; DCoed is a binary variable, which takes on the value of 1 if you live on a coed floor, and 0 if otherwise; DFemme is a binary variable, which is 1 for females and zero otherwise; DRoommate is a binary variable which equals 1 if the person at the table has a roommate and is zero otherwise; DAthlete is a binary variable which is 1 if the person at the table is a ECON2P91 - Business Econometrics with Applications Makeup Assignment - (FALL 2020) Page 4|6 member of an athletic varsity team; DCons is a variable which measures the political tendency of the person at the table on a seven-point scale, ranging from 1 being "liberal" to 7 being "conservative"; SAT is the SAT score of the person at the table measured on a seven-point scale, ranging from 1 for the category "900-1000" to 7 for the category "1510 and above"; and increasing by one for 100 point increases (we are considering the same SAT scaling between Canada & US education systems); and SibOther is the number of siblings from the opposite gender in the family the person at the table grew up with. (a) Indicate which of the coefficients are statistically significant. (b) Based on the above results, the Dean decides to specify a more parsimonious form by eliminating the least significant variables. Using the F-statistic for the null hypothesis that there is no relationship between the gender composition at the table and DFemme, DRoommate, DAthlete, and SAT, the regression package returns a value of 1.10. What are the degrees of freedom for the statistic? Look up the 1% and 5% critical values from the F- table and make a decision about the exclusion of these variables based on the critical values. (c) The Dean decides to estimate the following specification next: Gendercomp = 29.07- (3.75)3.80(0.62)*Size- 9.75(1.04)*DCoed + 1.50 (1.04)*DCons+ 1.97(1.44)*SibOther R2 = 0.22 SER = 15.44 Calculate the t-statistics for the coefficients and discuss whether or not the Dean should attempt to simplify the specification further. Based on the results, what might some of the comments be that she will write up for the other senior administrators of Brock? What are some of the potential flaws in her analysis? What other variables do you think she should have considered as explanatory factors? Brock's administration is thinking about implementing a policy of coed floors only in dormitories. Currently there are only single gender floors. One reason behind such a policy might be to generate an atmosphere of better "understanding" between the sexes. The Dean of Students (DoS) has decided to investigate if such a behavior results in more "togetherness" by attempting to find the determinants of the gender composition at the dinner table in your main dining hall, and in that of McMaster University, which only allows for coed floors in their dorms. The survey includes 176 students, 63 from Brock, and 113 from McMaster. The Dean's first problem is how to define gender composition. To begin with, the survey excludes single persons' tables, since the study is to focus on group behavior. The Dean also eliminates sports teams from the analysis, since a large number of single-gender students will sit at the same table. Finally, the Dean decides to only analyze tables with three or more students, since she worries about "couples" distorting the results. The Dean finally settles for the following specification of the dependent variable: GenderComp= | (50%-% of Male Students at Table)| Where " |(...z...)| " stands for the absolute value of (...Z...). The variable can take on values from zero to fifty. After considering various explanatory variables, the Dean settles for an initial list of eight, and estimates the following relationship, using heteroskedasticity-robust standard errors (this Dean obviously has taken an econometrics course earlier in her career and/or has an able research assistant): Gendercomp = 30.90- (7.73)3.78(0.63)*Size- 8.81(2.66)*DCoed + 2.28 (2.42)*DFemme +2.06 (2.39)*DRommmate- 0.17(3.23)*DAthlete + 1.49 (1.10)* DCons- 0.81(1.20)*SAT+ 1.74(1.43)*SibOther R2= 0.24, SER = 15.50 Where: Size is the number of persons at the table minus 3; DCoed is a binary variable, which takes on the value of 1 if you live on a coed floor, and 0 if otherwise; DFemme is a binary variable, which is 1 for females and zero otherwise; DRoommate is a binary variable which equals 1 if the person at the table has a roommate and is zero otherwise; DAthlete is a binary variable which is 1 if the person at the table is a ECON2P91 - Business Econometrics with Applications Makeup Assignment - (FALL 2020) Page 4|6 member of an athletic varsity team; DCons is a variable which measures the political tendency of the person at the table on a seven-point scale, ranging from 1 being "liberal" to 7 being "conservative"; SAT is the SAT score of the person at the table measured on a seven-point scale, ranging from 1 for the category "900-1000" to 7 for the category "1510 and above"; and increasing by one for 100 point increases (we are considering the same SAT scaling between Canada & US education systems); and SibOther is the number of siblings from the opposite gender in the family the person at the table grew up with. (a) Indicate which of the coefficients are statistically significant. (b) Based on the above results, the Dean decides to specify a more parsimonious form by eliminating the least significant variables. Using the F-statistic for the null hypothesis that there is no relationship between the gender composition at the table and DFemme, DRoommate, DAthlete, and SAT, the regression package returns a value of 1.10. What are the degrees of freedom for the statistic? Look up the 1% and 5% critical values from the F- table and make a decision about the exclusion of these variables based on the critical values. (c) The Dean decides to estimate the following specification next: Gendercomp = 29.07- (3.75)3.80(0.62)*Size- 9.75(1.04)*DCoed + 1.50 (1.04)*DCons+ 1.97(1.44)*SibOther R2 = 0.22 SER = 15.44 Calculate the t-statistics for the coefficients and discuss whether or not the Dean should attempt to simplify the specification further. Based on the results, what might some of the comments be that she will write up for the other senior administrators of Brock? What are some of the potential flaws in her analysis? What other variables do you think she should have considered as explanatory factors? Brock's administration is thinking about implementing a policy of coed floors only in dormitories. Currently there are only single gender floors. One reason behind such a policy might be to generate an atmosphere of better "understanding" between the sexes. The Dean of Students (DoS) has decided to investigate if such a behavior results in more "togetherness" by attempting to find the determinants of the gender composition at the dinner table in your main dining hall, and in that of McMaster University, which only allows for coed floors in their dorms. The survey includes 176 students, 63 from Brock, and 113 from McMaster. The Dean's first problem is how to define gender composition. To begin with, the survey excludes single persons' tables, since the study is to focus on group behavior. The Dean also eliminates sports teams from the analysis, since a large number of single-gender students will sit at the same table. Finally, the Dean decides to only analyze tables with three or more students, since she worries about "couples" distorting the results. The Dean finally settles for the following specification of the dependent variable: GenderComp= | (50%-% of Male Students at Table)| Where " |(...z...)| " stands for the absolute value of (...Z...). The variable can take on values from zero to fifty. After considering various explanatory variables, the Dean settles for an initial list of eight, and estimates the following relationship, using heteroskedasticity-robust standard errors (this Dean obviously has taken an econometrics course earlier in her career and/or has an able research assistant): Gendercomp = 30.90- (7.73)3.78(0.63)*Size- 8.81(2.66)*DCoed + 2.28 (2.42)*DFemme +2.06 (2.39)*DRommmate- 0.17(3.23)*DAthlete + 1.49 (1.10)* DCons- 0.81(1.20)*SAT+ 1.74(1.43)*SibOther R2= 0.24, SER = 15.50 Where: Size is the number of persons at the table minus 3; DCoed is a binary variable, which takes on the value of 1 if you live on a coed floor, and 0 if otherwise; DFemme is a binary variable, which is 1 for females and zero otherwise; DRoommate is a binary variable which equals 1 if the person at the table has a roommate and is zero otherwise; DAthlete is a binary variable which is 1 if the person at the table is a ECON2P91 - Business Econometrics with Applications Makeup Assignment - (FALL 2020) Page 4|6 member of an athletic varsity team; DCons is a variable which measures the political tendency of the person at the table on a seven-point scale, ranging from 1 being "liberal" to 7 being "conservative"; SAT is the SAT score of the person at the table measured on a seven-point scale, ranging from 1 for the category "900-1000" to 7 for the category "1510 and above"; and increasing by one for 100 point increases (we are considering the same SAT scaling between Canada & US education systems); and SibOther is the number of siblings from the opposite gender in the family the person at the table grew up with. (a) Indicate which of the coefficients are statistically significant. (b) Based on the above results, the Dean decides to specify a more parsimonious form by eliminating the least significant variables. Using the F-statistic for the null hypothesis that there is no relationship between the gender composition at the table and DFemme, DRoommate, DAthlete, and SAT, the regression package returns a value of 1.10. What are the degrees of freedom for the statistic? Look up the 1% and 5% critical values from the F- table and make a decision about the exclusion of these variables based on the critical values. (c) The Dean decides to estimate the following specification next: Gendercomp = 29.07- (3.75)3.80(0.62)*Size- 9.75(1.04)*DCoed + 1.50 (1.04)*DCons+ 1.97(1.44)*SibOther R2 = 0.22 SER = 15.44 Calculate the t-statistics for the coefficients and discuss whether or not the Dean should attempt to simplify the specification further. Based on the results, what might some of the comments be that she will write up for the other senior administrators of Brock? What are some of the potential flaws in her analysis? What other variables do you think she should have considered as explanatory factors?
Expert Answer:
Answer rating: 100% (QA)
The administration of your universitycollege is thinking about implementing a policy of coed floors ... View the full answer

Related Book For 

Posted Date:
Students also viewed these accounting questions
-
A researcher on superstition decided to investigate if walking under a ladder really brought about bad luck. He took 100 people to his laboratory, one at a time. As each person entered, he flipped a...
-
An anti-doping agency decided to investigate if an athletes eliteness was related to the likelihood of doping. It unexpectedly drug-tested the top 10 finishers in all the track and field events at a...
-
The dean of the graduate business administration school at University of Texas at Austin wants to select a sample of 100 students who applied to one of five majors. The numbers of applicants for each...
-
Determine the reactions at the beam supports for the given loading when wO = 400 lb/ft. 300 lb/ft A. 5 ft
-
Lake Corporation has some severe cash-flow problems. You are the companys financial and tax consultant. Thetreasurer of the company has informed you that the company has failed to make FICA and...
-
Refrigerant-134a enters an adiabatic compressor at 2308C as a saturated vapor at a rate of 0.45 m3/min and leaves at 900 kPa and 558C. Determine (a) the power input to the compressor, (b) the...
-
What System/Product Life Cycle Phases are covered by the ConOps?
-
The Collectors Choice Inc. ( CCI), a luxury car import company, has an old warehouse at the Port of Miami, Florida, where it temporarily stores expensive sports cars and automotive parts that arrive...
-
If you receive $585 each 6 months for 1 year and the discount rate is 0.09%, what is the present value? If you receive $236 each month for 12 months and the discount rate is 4.7%, what is the present...
-
Use discriminant analysis to classify the new data in the Excel file Credit Approval Decisions Coded using only credit score and years of credit history as input variables.
-
Hyten Corporation On June 5, 1998, a meeting was held at Hyten Corporation, between Bill Knapp, Director of Marketing/Sales, and John Rich, director of engineering. The purpose of the meeting was to...
-
Enron Corp. was an energy company that was incorporated in Oregon in 1985, with its principal executive offices located in Houston, Texas. By the end of 2001, Enron Corp. was the world's largest...
-
Justify the statement that casting is most versatile forms of a mechanical process for producing components.
-
Sarazan Company issues a 4-year, 7.5% fixed-rate interest only, nonprepayable 1,000,000 note payable on December 31, 2015. It decides to change the interest rate from a fixed rate to variable rate...
-
Briefly discuss the three types of flames used in gas welding and mention their applications.
-
On 1 July 2021 the business bought on credit specialised equipment at a total cost including installation of $68 981 ($62 710 + $6271 GST). It is to be depreciated using the diminishing balance...
-
Scenario You are a bookkeeper at a small manufacturing company called "Tech Gear Pro." The company specialises in producing high-quality electronic gadgets. Recently, the management has been...
-
Conduct a VRIO analysis by ranking Husson University (in Maine) business school in terms of the following six dimensions relative to the top three rival schools. If you were the dean with a limited...
-
f(x) = 2x, g(x) = -2x Graph both functions by hand on the same coordinate system.
-
a. Carefully graph the given equation by hand. Then find the slope of the line by using the ratio rise/run. i. y = 2x + 1 ii. y = 3x 5 iii. Y = 2x + 6 b. Compare the slope of each line with the...
-
Y = 2 Determine the slope and the y-intercept. Use them to graph the equation by hand
-
The electric motor with an attached disk is running at a constant low speed of \(120 \mathrm{rev} / \mathrm{min}\) in the direction shown. Its housing and mounting base are initially at rest. The...
-
The motor housing and its bracket rotate about the \(Z\)-axis at the constant rate \(\Omega=3 \mathrm{rad} / \mathrm{s}\). The motor shaft and disk have a constant angular velocity of spin \(p=8...
-
The bent plate has a mass of \(70 \mathrm{~kg}\) per square meter of surface area and revolves about the \(z\)-axis at the rate \(\omega=30 \mathrm{rad} / \mathrm{s}\). Determine (a) the angular...

Study smarter with the SolutionInn App