

Help me how to create System Design Diagram? System Designs are designsthat give a high level
Question:
Help me how to create System Design Diagram?
System Designs are designs that give a high level view of the components involved. They are the road maps for your corporate IT infrastructure. They also help you look for performance bottlenecks, scale ability issues, and opportunities to use vendors and open-source solutions. System designs include components such as user groups, applications, data/process management systems, and the groups of data being managed.
User Groups. These are the categories of users that use systems. High level user groups can include customers/clients, employees, management, and executives. You can provide more detailed user groups by their titles and demographic information.
Applications. These are programs that help users interface with other system components. They can include data entry applications, reporting systems, performance tools, business intelligence, and data mining tools.
Database Management Systems. These are programs that manage computer processes and/or data. They can be used to manage data, services, quality and performance.
Databases. These are files and repositories that store data. They cannot do anything on there own. They are accessed and manipulated by users, applications, and management systems.
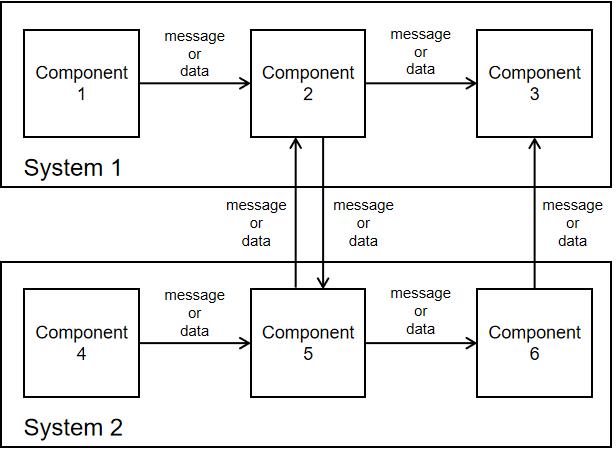
System Diagrams are visual diagrams of your system designs. They give a high level overview of systems and show which components have which responsibilities. They also include how components talk to each other through arrows. The tail of the arrow is on component requesting/sending the data.
To facilitate understanding system diagrams are designed to be read from left to right, top to bottom like a book.
In the diagram above Component 1 is sending a message / data / request to Component 2.
You can use boxes to group components together into systems. You can use arrows that describe how a component from one system interacts with a component from another system.
Database Systems
A system diagram helps designers see at a glance the differences of system behaviour from a high level. This is useful for visually showing the differences between database systems.
- Operational Systems. Or OPS Systems, are used to support daily operations of the company. Users view data using reporting applications and view/manipulate data though data entry applications. These applications send/receive data from the OPS DBMS. The OPS DBMS sends/retrieves data from the Operational Database or OPS DB.
- Data Warehouse Systems. Or D/W Systems, are used to load and aggregate data on a daily, weekly, or monthly basis. This loaded data is read only. Users request applications to tell the D/W DBMS to load the data into the D/W DB by notifying the OPS DBMS. The D/W DB is designed for heavy computer processing. Because of this data warehouses typically doesn't prepare data for operational reporting. Operational reporting is done strictly by the Operational System
- Business Intelligence Systems. Or BI Systems, are used to help users see patterns in the data through comparisons, inclusions, and omissions. The user requests the data from the application which tells the BI DBMS to retrieve the data from the BI D/W and send that data to the application or reporting system the user is using. On a daily, weekly, or monthly schedule the BI DB is loaded with new data from the D/W System. The user would retrieve the data and then use filtering and pivots to do analysis. The user shouldn't need to know how the data is stored in the Operation database nor the Data Warehouse database.
System Diagram
- To create a new document using a drafting or visual modeling tool of your choice
- Draw the operational system based on its description using the notation specified by the system diagram examples
- Add the arrows between your operational system components that best describe the system's behaviour. Label each arrow with at most three words.
- Repeat steps (2) and (3) for the data warehouse system.
- Repeat steps (2) and (3) for the business intelligence system.
- Add the arrows between the operational, data warehouse, and business intelligence system components that best explains their interactions. Label each arrow with at most three words.
- Add a separate system called Client to represent customers' systems. Include all four components and their interactions for the Client system. Add interaction arrows to and from the Client's components and other system components describing how this system interacts with the other systems. Use what you know about Final Close as a guide.
Expert Answer:
Creating a System Design Diagram involves several steps and its important to have clarity on the components and their interactions within the system H... View the full answer


Financial Reporting Financial Statement Analysis and Valuation a strategic perspective
ISBN: 978-1337614689
9th edition
Authors: James M. Wahlen, Stephen P. Baginski, Mark Bradshaw
