

The purpose of this analysis is to assist in confirming or denying the advertisement put forth...
Fantastic news! We've Found the answer you've been seeking!
Question:
![Introduction [Include in this section a brief overview, including the purpose of this analysis.] Setup [Define your populatio](https://dsd5zvtm8ll6.cloudfront.net/si.experts.images/questions/2022/03/6234567f7e0bd_1647597171376.jpg)
![[Use the normal curve graph as a reference to describe where the p value and test statistic would be placed.] Test Decision [](https://dsd5zvtm8ll6.cloudfront.net/si.experts.images/questions/2022/03/6234567dc9dc5_1647597171541.jpg)
Transcribed Image Text:
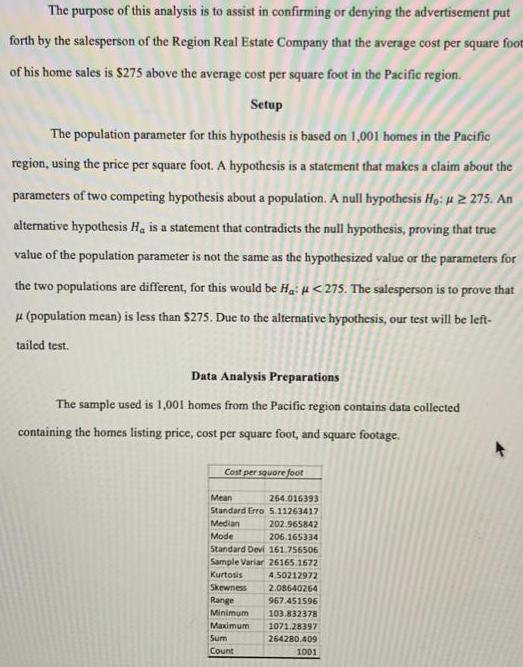
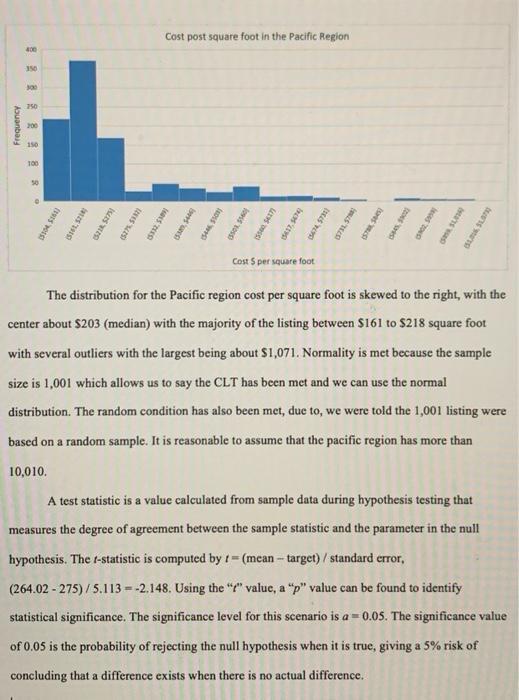
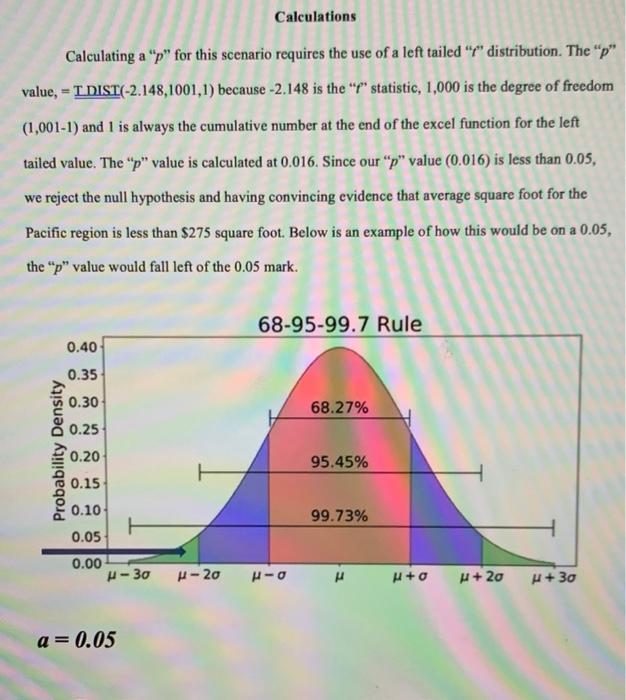
The purpose of this analysis is to assist in confirming or denying the advertisement put forth by the salesperson of the Region Real Estate Company that the average cost per square foot of his home sales is $275 above the average cost per square foot in the Pacific region. Setup The population parameter for this hypothesis is based on 1,001 homes in the Pacific region, using the price per square foot. A hypothesis is a statement that makes a claim about the parameters of two competing hypothesis about a population. A null hypothesis Ho: #2275. An alternative hypothesis Ha is a statement that contradicts the null hypothesis, proving that true value of the population parameter is not the same as the hypothesized value or the parameters for the two populations are different, for this would be Ha: <275. The salesperson is to prove that (population mean) is less than $275. Due to the alternative hypothesis, our test will be left- tailed test. Data Analysis Preparations The sample used is 1,001 homes from the Pacific region contains data collected containing the homes listing price, cost per square foot, and square footage. Cost per square foot Mean 264.016393 Standard Erro 5.11263417 Median Mode 202.965842 206.165334 Standard Devi 161.756506 Sample Variar 26165.1672 Kurtosis 4.50212972 Skewness 2.08640264 967.451596 103.832378 1071.28397 264280.409 Range Minimum Maximum Sum Count 1001 Frequency 400 350 300 250 200 150 100 50 (3104,5161) (3161, 521) (25275 (5275,537) Cost post square foot in the Pacific Region 53325109 (53,5446) (5446,5101) (3501140 (55405417) bos 20 Cost S per square foot (5474,5731) TEL (578,5845) (545) NGA ZON (HEATS WAS BLOK, SLAT The distribution for the Pacific region cost per square foot is skewed to the right, with the center about $203 (median) with the majority of the listing between $161 to $218 square foot with several outliers with the largest being about $1,071. Normality is met because the sample size is 1,001 which allows us to say the CLT has been met and we can use the normal distribution. The random condition has also been met, due to, we were told the 1,001 listing were based on a random sample. It is reasonable to assume that the pacific region has more than 10,010. A test statistic is a value calculated from sample data during hypothesis testing that measures the degree of agreement between the sample statistic and the parameter in the null hypothesis. The t-statistic is computed by t= (mean-target) / standard error, 1= (264.02-275)/5.113= -2.148. Using the "/" value, a "p" value can be found to identify statistical significance. The significance level for this scenario is a = 0.05. The significance value of 0.05 is the probability of rejecting the null hypothesis when it is true, giving a 5% risk of concluding that a difference exists when there is no actual difference. Calculating a "p" for this scenario requires the use of a left tailed "7" distribution. The "p" value, - TDIST(-2.148,1001,1) because -2.148 is the "f" statistic, 1,000 is the degree of freedom = (1,001-1) and 1 is always the cumulative number at the end of the excel function for the left tailed value. The "p" value is calculated at 0.016. Since our "p" value (0.016) is less than 0.05, we reject the null hypothesis and having convincing evidence that average square foot for the Pacific region is less than $275 square foot. Below is an example of how this would be on a 0.05, the "p" value would fall left of the 0.05 mark. Probability Density 0.40 0.35 0.30 0.25 0.20 0.15 0.10- 0.05 0.00 H-30 a = 0.05 Calculations H-20 68-95-99.7 Rule HIO 68.27% 95.45% 99.73% H+0 μ+20 H+30 Test Decision The conclusion is that the null hypothesis is rejected because p=0.016<0.05 (the significance level). Because the "p" value is less than the specified significance level, two possibilities exist; one: the null hypothesis is true, and the observed data is relatively unusual with a sample statistic that is extremely due to chance or, two: the null hypothesis is false, and the alternative hypothesis provides a more reasonable explanation for the population parameter. The "p" value (0.016) means there is a 1.6% probability that a result with an extreme deviation from the null hypothesis is due to chance. This low "p" value shows a statistically significant decision has been made to reject the null hypothesis. Conclusion The hypothesis testing completed for this scenario would allow the salesperson to advertise the average cost per square foot of his home sale is above average. The conclusion is statistically significant because of a very low "p" value (0.016). The salesperson claim that his home sales sell at a higher-than-average cost per square foot should be accepted and he should continue with his advertisement, there is sufficient evidence and statistical significance to endorse his claim. [Explain in one paragraph how your test decision relates to your hypothesis and whether your conclusions are statistically significant.] Introduction [Include in this section a brief overview, including the purpose of this analysis.] Setup [Define your population parameter.] [Write the null and alternative hypotheses. Note: Remember, the salesperson believes that his sales are higher.] [Specify the name of the test you will use and identify whether it is a left-tailed, right- tailed, or two-tailed test.] Data Analysis Preparations [Describe the sample.] I [Provide the descriptive statistics of the sample.] [Provide a histogram of the sample.] [Specify whether the assumptions or conditions to perform your identified test have been met.] [Identify the appropriate test statistic, then calculate the test statistic and identify your significance level.] Calculations [Calculate the p value using one of the following tests: -T.DIST RT([test statistic], [degree of freedom]) =T.DIST([test statistic], [degree of freedom], 1) =T.DIST.21([test statistic], [degree of freedom]) Note: For right-tailed, use the T.DIST.RT function in Excel, left-tailed is the T.DIST function, and two-tailed is the T.DIST.2T function. The degree of freedom is calculated by subtracting 1 from your sample size.] [Use the normal curve graph as a reference to describe where the p value and test statistic would be placed.] Test Decision [Discuss how the p value relates to the significance level.] [Compare the p value and significance level, and make a decision to reject or fail to reject the null hypothesis.] I [Explain in one paragraph how your test decision relates to your hypothesis and whether your conclusions are statistically significant.] Conclusion The purpose of this analysis is to assist in confirming or denying the advertisement put forth by the salesperson of the Region Real Estate Company that the average cost per square foot of his home sales is $275 above the average cost per square foot in the Pacific region. Setup The population parameter for this hypothesis is based on 1,001 homes in the Pacific region, using the price per square foot. A hypothesis is a statement that makes a claim about the parameters of two competing hypothesis about a population. A null hypothesis Ho: #2275. An alternative hypothesis Ha is a statement that contradicts the null hypothesis, proving that true value of the population parameter is not the same as the hypothesized value or the parameters for the two populations are different, for this would be Ha: <275. The salesperson is to prove that (population mean) is less than $275. Due to the alternative hypothesis, our test will be left- tailed test. Data Analysis Preparations The sample used is 1,001 homes from the Pacific region contains data collected containing the homes listing price, cost per square foot, and square footage. Cost per square foot Mean 264.016393 Standard Erro 5.11263417 Median Mode 202.965842 206.165334 Standard Devi 161.756506 Sample Variar 26165.1672 Kurtosis 4.50212972 Skewness 2.08640264 967.451596 103.832378 1071.28397 264280.409 Range Minimum Maximum Sum Count 1001 Frequency 400 350 300 250 200 150 100 50 (3104,5161) (3161, 521) (25275 (5275,537) Cost post square foot in the Pacific Region 53325109 (53,5446) (5446,5101) (3501140 (55405417) bos 20 Cost S per square foot (5474,5731) TEL (578,5845) (545) NGA ZON (HEATS WAS BLOK, SLAT The distribution for the Pacific region cost per square foot is skewed to the right, with the center about $203 (median) with the majority of the listing between $161 to $218 square foot with several outliers with the largest being about $1,071. Normality is met because the sample size is 1,001 which allows us to say the CLT has been met and we can use the normal distribution. The random condition has also been met, due to, we were told the 1,001 listing were based on a random sample. It is reasonable to assume that the pacific region has more than 10,010. A test statistic is a value calculated from sample data during hypothesis testing that measures the degree of agreement between the sample statistic and the parameter in the null hypothesis. The t-statistic is computed by t= (mean-target) / standard error, 1= (264.02-275)/5.113= -2.148. Using the "/" value, a "p" value can be found to identify statistical significance. The significance level for this scenario is a = 0.05. The significance value of 0.05 is the probability of rejecting the null hypothesis when it is true, giving a 5% risk of concluding that a difference exists when there is no actual difference. Calculating a "p" for this scenario requires the use of a left tailed "7" distribution. The "p" value, - TDIST(-2.148,1001,1) because -2.148 is the "f" statistic, 1,000 is the degree of freedom = (1,001-1) and 1 is always the cumulative number at the end of the excel function for the left tailed value. The "p" value is calculated at 0.016. Since our "p" value (0.016) is less than 0.05, we reject the null hypothesis and having convincing evidence that average square foot for the Pacific region is less than $275 square foot. Below is an example of how this would be on a 0.05, the "p" value would fall left of the 0.05 mark. Probability Density 0.40 0.35 0.30 0.25 0.20 0.15 0.10- 0.05 0.00 H-30 a = 0.05 Calculations H-20 68-95-99.7 Rule HIO 68.27% 95.45% 99.73% H+0 μ+20 H+30 Test Decision The conclusion is that the null hypothesis is rejected because p=0.016<0.05 (the significance level). Because the "p" value is less than the specified significance level, two possibilities exist; one: the null hypothesis is true, and the observed data is relatively unusual with a sample statistic that is extremely due to chance or, two: the null hypothesis is false, and the alternative hypothesis provides a more reasonable explanation for the population parameter. The "p" value (0.016) means there is a 1.6% probability that a result with an extreme deviation from the null hypothesis is due to chance. This low "p" value shows a statistically significant decision has been made to reject the null hypothesis. Conclusion The hypothesis testing completed for this scenario would allow the salesperson to advertise the average cost per square foot of his home sale is above average. The conclusion is statistically significant because of a very low "p" value (0.016). The salesperson claim that his home sales sell at a higher-than-average cost per square foot should be accepted and he should continue with his advertisement, there is sufficient evidence and statistical significance to endorse his claim. [Explain in one paragraph how your test decision relates to your hypothesis and whether your conclusions are statistically significant.] Introduction [Include in this section a brief overview, including the purpose of this analysis.] Setup [Define your population parameter.] [Write the null and alternative hypotheses. Note: Remember, the salesperson believes that his sales are higher.] [Specify the name of the test you will use and identify whether it is a left-tailed, right- tailed, or two-tailed test.] Data Analysis Preparations [Describe the sample.] I [Provide the descriptive statistics of the sample.] [Provide a histogram of the sample.] [Specify whether the assumptions or conditions to perform your identified test have been met.] [Identify the appropriate test statistic, then calculate the test statistic and identify your significance level.] Calculations [Calculate the p value using one of the following tests: -T.DIST RT([test statistic], [degree of freedom]) =T.DIST([test statistic], [degree of freedom], 1) =T.DIST.21([test statistic], [degree of freedom]) Note: For right-tailed, use the T.DIST.RT function in Excel, left-tailed is the T.DIST function, and two-tailed is the T.DIST.2T function. The degree of freedom is calculated by subtracting 1 from your sample size.] [Use the normal curve graph as a reference to describe where the p value and test statistic would be placed.] Test Decision [Discuss how the p value relates to the significance level.] [Compare the p value and significance level, and make a decision to reject or fail to reject the null hypothesis.] I [Explain in one paragraph how your test decision relates to your hypothesis and whether your conclusions are statistically significant.] Conclusion
Expert Answer:

Related Book For 

Managerial Economics and Strategy
ISBN: 978-0134167879
2nd edition
Authors: Jeffrey M. Perloff, James A. Brander
Posted Date:
Students also viewed these sociology questions
-
Here are five questions written by one of your systems analysis team members. Her interviewee is the local manager of LOWCO, an outlet of a national discount chain, who has asked you to work on a...
-
Here are some questions for practicing unit conversions: (a) How long is a nanoyear in seconds? (b) Micrometers are often called microns. How long is a megamicron? (c) How many bytes are there in a...
-
Here are the guiding questions for the J Crew case. Remember to read the questions before you begin reading the case. 1. How strong are the competitive forces confronting J. Crew in the market for...
-
The per-unit cost of an item is its average total cost (5 total cost/quantity). Suppose that a new cell phone application costs $100,000 to develop and only $.50 per unit to deliver to each cell...
-
Given typical inherent and fraud risks related to material misstatement of debt obligations, identify controls that an auditor would expect a client to have implemented.
-
Picabo, an aggressive skier, spends her entire income on skis and bindings. She wears out one pair of skis for every pair of bindings she wears out. a. Graph Picabos indifference curves for skis and...
-
Match threats in the first column to appropriate control procedures in the second column. Threat 1. Sending incorrect merchandise Control Procedure a. Perform a completeness check 2. Crediting...
-
Consider the following situations for Shocker: a. On November 28, 2015, Shocker receives a $4,500 payment from a customer for services to be rendered evenly over the next three months. Unearned...
-
One-dimensional wave equation 1. Find u(x, t) for the string of length L = 1 and c = 1 when the initial velocity is zero and the initial deflection with small k (say, 0.01) is as follows. b) kx(1-x)
-
Wolsey Industries Inc. expects to maintain the same inventories at the end of 20Y3 as at the beginning of the year. The total of all production costs for the year is therefore assumed to be equal to...
-
if a company that sells 3 0 million in merchandise every year estimates that about 1 million in merchandise will be returned for refund how should this revenue be recognized and reported ?
-
Consider an open economy IS-LM model. China's currency is the "Chinese Yuan Renminbi (CNY)" and the USA's currency is the "US dollar (USD)". China has a fixed exchange rate regime with respect to...
-
Problem #6: The admissions office at a university is trying to develop a plan for the following year's entering class. They have 4500 openings for freshmen. Tuition is S 8600 for students who live in...
-
Maryville University terminates an employees employment after the employee was late for work several times, had a bad attitude, repeatedly expressed unsolicited political opinions to customers, and...
-
Address possible analogies between a university and a product development organization. Would you consider a university as organized with primarily a functional or product focus? 2.What (if any)...
-
Estimate the limit lim xx 84*
-
The words isolated and insulated sound similar. In our everyday language, we use these words metaphorically; we may say that Bobby is isolated or Bobby is insulated. What subtle difference exists...
-
What are some of the features of the Unified Process (UP)?
-
The Mini-Case, Pay-for-Delay Agreements states that some incumbent producers of drugs with expiring patents paid potential generic producers to delay entry into the market. Why were incumbents...
-
Why are electronic textbooks likely to facilitate price discrimination?
-
Milton Friedman argued that managers should try to maximize profit. Does his view conflict with the actions taken by senior executives of McDonalds to use corporate resources to support Ronald...
-
Why is an adjustment for accrued federal income tax never planned on a partnership work sheet?
-
When does a deficit occur?
-
What account is debited when a partner withdraws supplies for personal use?

Study smarter with the SolutionInn App