Answered step by step
Verified Expert Solution
Question
1 Approved Answer
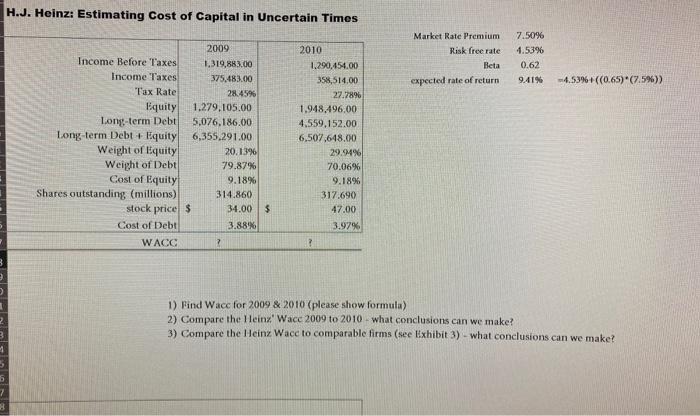
H.J. Heinz: Estimating Cost of Capital in Uncertain Times Income Before Taxes Income Taxes Tax Rate Equity Long-term Debt Long-term Debt + Equity Weight


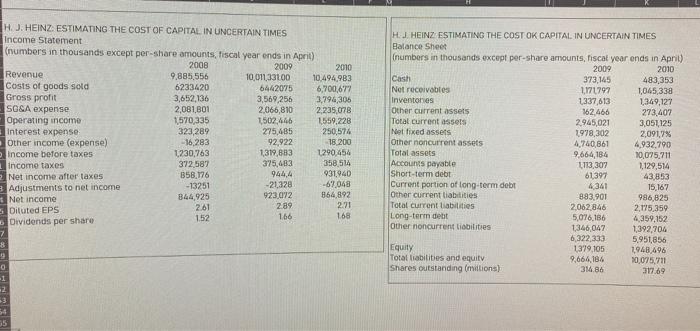
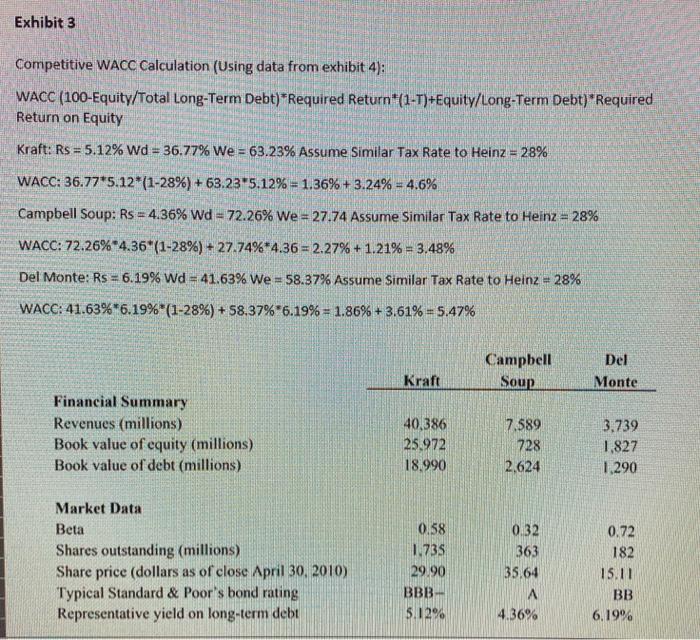
H.J. Heinz: Estimating Cost of Capital in Uncertain Times Income Before Taxes Income Taxes Tax Rate Equity Long-term Debt Long-term Debt + Equity Weight of Equity Weight of Debt Cost of Equity Shares outstanding (millions) stock price $ Cost of Debt WACC 2009 1,319,883.00 375,483.00 28.45% 1,279,105.00 5,076,186.00 6,355,291.00 20.13% 79.87% 9.18% 314.860 34.00 3.88% ? $ 2010 1,290,454.00 358,514.00 27.78% 1,948,496.00 4,559,152.00 6,507,648.00 ? 29.94% 70.06% 9.18% 317.690 47.00 3.97% 1) Find Wacc for 2009 & 2010 (please show formula) 2) Compare the Heinz' Wacc 2009 to 2010 3) Compare the Heinz Wacc to comparable Market Rate Premium Risk free rate Beta expected rate of return 7.50% 4.53% 0.62 9.41% -4.53% + ((0.65)*(7.5%)) what conclusions can we make? firms (see Exhibit 3)- what conclusions can we make? H. J. HEINZ ESTIMATING THE COST OF CAPITAL IN UNCERTAIN TIMES Income Statement (numbers in thousands except per-share amounts, fiscal year ends in April) 2009 2008 9,885,556 6233420 3,652,136 2,081,801 1,570,335 323,289 -16,283 Revenue Costs of goods sold Gross profit SG&A expense Operating income Net income after taxes Adjustments to net income Net income 5 Dituted EPS 7 8 Interest expense Other income (expense) Income before taxes income taxes 9 0 1 -2 $3 35 Dividends per share 1,230,763 372,587 858,176 -13251 844,925 2.61 1.52 10,011,33100 6442075 3,569,256 2,066,810 1,502,446 275,485 92,922 1,319,883 375,483 944,4 -21,328 923,072 2.89 1.66 2010 10,494,983 6,700,677 3,796,306 2,235,078 1,559,228 250,574 18,200 1290,454 358,514 931,940 -67,048 864,892 2.71 1.68 H.J. HEINZ ESTIMATING THE COST OK CAPITAL IN UNCERTAIN TIMES Balance Sheet (numbers in thousands except per-share amounts, fiscal year ends in April) 2009 2010 Cash Not receivables Inventories Other current assets Total current assets Net fixed assets Other noncurrent assets Total assets Accounts payable Short-term debt Current portion of long-term debt Other current liabilities Total current liabilities Long-term debt Other noncurrent liabilities. Equity Total liabilities and equity Shares outstanding (millions) 373,145 1,171797 1,337,613 162,466 2,945,021 1,978,302 4,740,861 9,664,184 1113,307 61,397 4,341 883,901 2,062,846 5,076,186 1,346,047 6,322,333 1379,105. 9,664,184 314.86 483,353 1,045,338 1,349,127 273,407 3,051,125 2,091,7% 4,932,790 10,075,711 1,129,514 43,853 15,167 986,825 2,175,359 4,359,152 1,392,704 5,951,856 1,948,496 10,075,711 317.69 Exhibit 3 Competitive WACC Calculation (Using data from exhibit 4): WACC (100-Equity/Total Long-Term Debt) *Required Return (1-T)+Equity/Long-Term Debt)"Required Return on Equity Kraft: Rs 5.12% Wd = 36.77% We = 63.23% Assume Similar Tax Rate to Heinz = 28% WACC: 36.77*5.12*(1-28%) + 63.23 5.12% = 1.36% + 3.24% = 4.6% Campbell Soup: Rs = 4.36% Wd = 72.26 % We = 27.74 Assume Similar Tax Rate to Heinz = 28% WACC: 72.26% 4.36*(1-28%) + 27.74% *4.36 = 2.27% + 1.21% = 3.48% Del Monte: Rs = 6.19% Wd=41.63% We = 58.37% Assume Similar Tax Rate to Heinz = 28% WACC: 41.63% 6.19 % *(1-28 %) + 58.37% *6.19% = 1.86 % +3.61% = 5.47% Financial Summary Revenues (millions) Book value of equity (millions) Book value of debt (millions) Market Data Beta Shares outstanding (millions) Share price (dollars as of close April 30, 2010) Typical Standard & Poor's bond rating Representative yield on long-term debt Kraft 40,386 25.972 18.990 0.58 1.735 29.90 BBB- 5.12% Campbell Soup 7.589 728 2,624 0.32 363 35.64 A 4.36% Del Monte 3,739 1,827 1,290 0.72 182 15.11 BB 6.19%
Step by Step Solution
There are 3 Steps involved in it
Step: 1
WACCweight of debtafter tax cost of debtweight of equitycost of debt after tax cost of d...
Get Instant Access to Expert-Tailored Solutions
See step-by-step solutions with expert insights and AI powered tools for academic success
Step: 2

Step: 3

Ace Your Homework with AI
Get the answers you need in no time with our AI-driven, step-by-step assistance
Get Started


