

The second picture is the needed data from P2 that P3 says is needed P3. Consider a
Question:
The second picture is the needed data from P2 that P3 says is needed
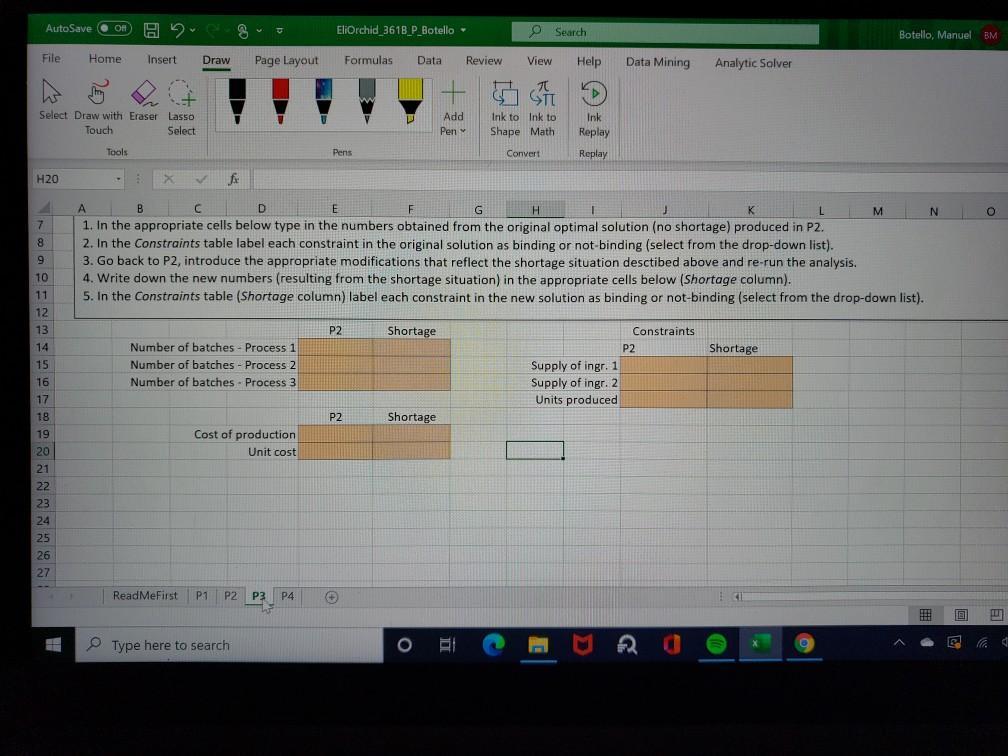
P3. Consider a possible shortage of ingredients in the following week. What would the optimized production process look like if Eli Orchid could only procure 4320 pounds of ingredient 1 and 1440 pounds of ingredient 2?
Follow these steps:
1. In the appropriate cells below type in the numbers obtained from the original optimal solution (no shortage) produced in P2.
2. In the Constraints table label each constraint in the original solution as binding or not-binding (select from the drop-down list).
3. Go back to P2, introduce the appropriate modifications that reflect the shortage situation described above and re-run the analysis.
4. Write down the new numbers (resulting from the shortage situation) in the appropriate cells below (Shortage column).
5. In the Constraints table (Shortage column) label each constraint in the new solution as binding or not-binding (select from the drop-down list).
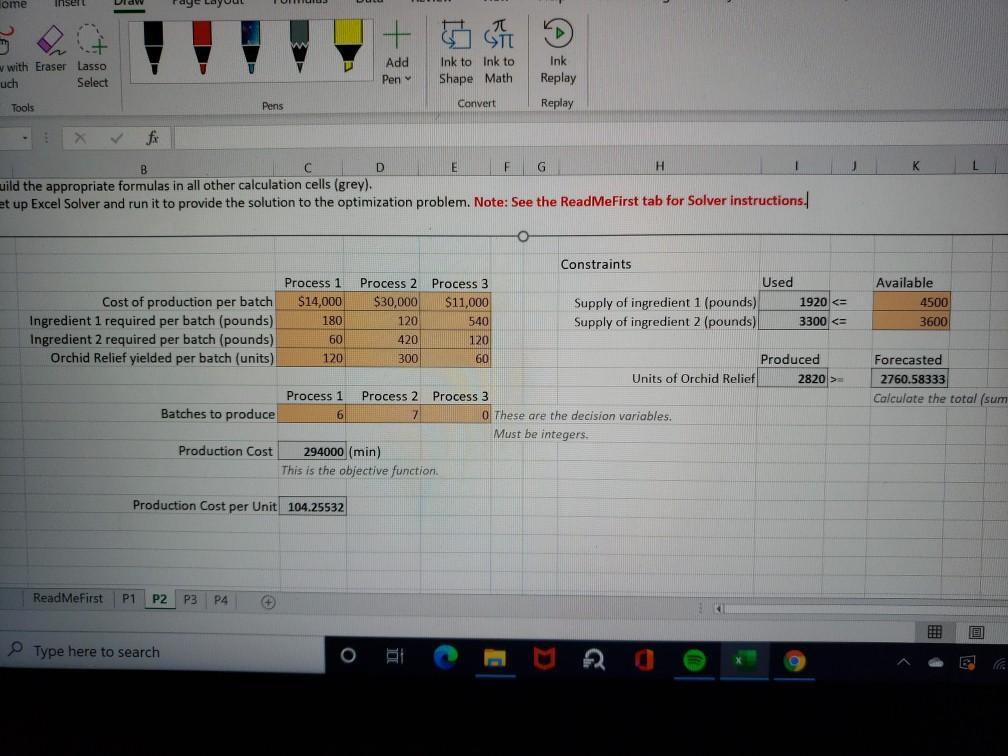
Here is the needed info from P2. P2 is complete but data is needed to solve P3
P2 The new pharmaceutical product that the company wishes to introduce, Orchid Relief, uses two new ingredients. At this stage, Eli Orchid can procure limited amounts of each ingredient. The company has 4500 pounds of ingredient 1 and 3600 pounds of ingredient 2 available for this week. Eli Orchid can manufacture the new product using any of its three existing processes that have different capabilities. The production with each of the processes is done in batches (a batch typically represents one full run of a machine from when it starts a task until it finishes it. Therefore, a batch is an integer). Each batch of production by each of the processes uses different amounts of ingredients 1 and 2, and results in different numbers of units of Orchid Relief produced.
Please use the above description and the model below to help Eli Orchid determine how many batches to produce with each process in the least costly way, given the limited availability of the two ingredients. Also, the total production of Orchid Relief in units must be greater than or equal to the total forecasted demand (in units) for week 10 (see P1).
Specifically:
1. In cell K20 calculate the forecasted total demand for days 64-70 (based on P1).
2. Build the appropriate formulas in all other calculation cells (grey).
3. Set up Excel Solver and run it to provide the solution to the optimization problem.
Expert Answer:
P2 To determine the optimal number of batches to produce with each process in the least costly way given the constraints we can use linear programming Lets define the decision variables Let x1 be the ... View the full answer


Systems analysis and design
ISBN: 978-0136089162
8th Edition
Authors: kenneth e. kendall, julie e. kendall
