

How much fruit do adolescent girls eat? Figure 1.14 (page 39) is a histogram of the number
Question:
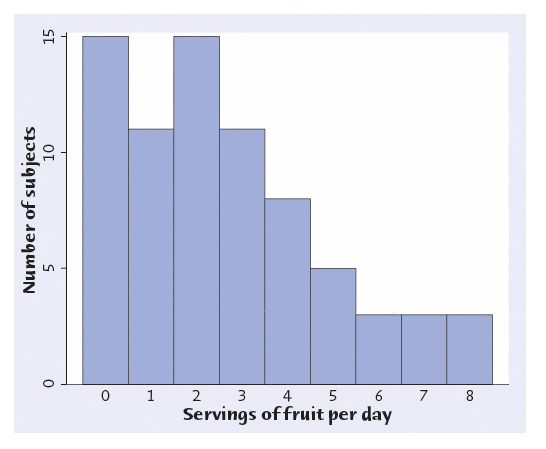
How much fruit do adolescent girls eat? Figure 1.14 (page 39) is a histogram of the number of servings of fruit per day claimed by 74 seventeen-year-old girls.
(a) With a little care, you can find the median and the quartiles from the histogram.What are these numbers? How did you find them?
(b) You can also find the mean number of servings of fruit claimed per day from the histogram. First use the information in the histogram to compute the sum of the 74 observations, and then use this to compute the mean. What is the relationship between the mean and median? Is this what you expected?
(c) In general, you cannot find the exact values of the median, quartiles, or mean from the histogram. What is special about the histogram of the number of servings of fruit that allows you to do this?
Expert Answer:
a The objective is to identify the median and quartiles from the histogram The total number of girls is 74 Therefore there are 37 girls in each half o... View the full answer


Statistics The Art and Science of Learning from Data
ISBN: 978-0321755940
3rd edition
Authors: Alan Agresti, Christine A. Franklin
