

Exhibit 1 ARCADIAN MICROARRAY TECHNOLOGIES, INC. Cash Flow Forecast by Arcadian Management Actual INCOME STATEMENT 2004...
Fantastic news! We've Found the answer you've been seeking!
Question:
Transcribed Image Text:
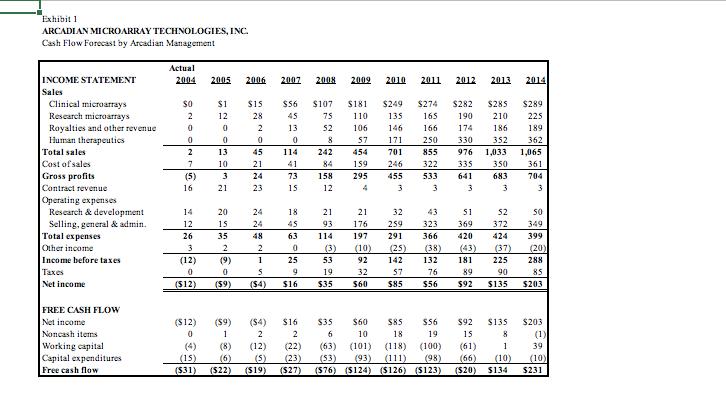
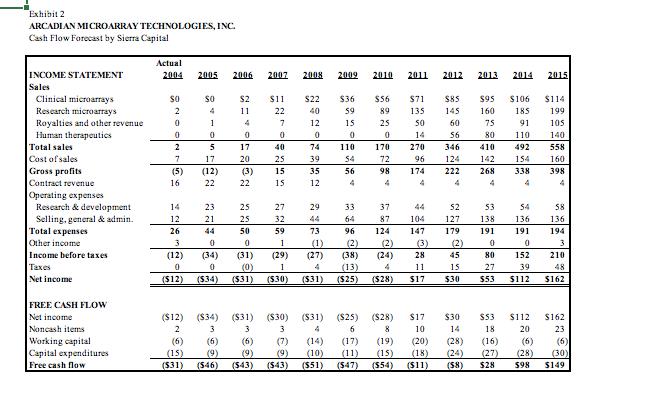
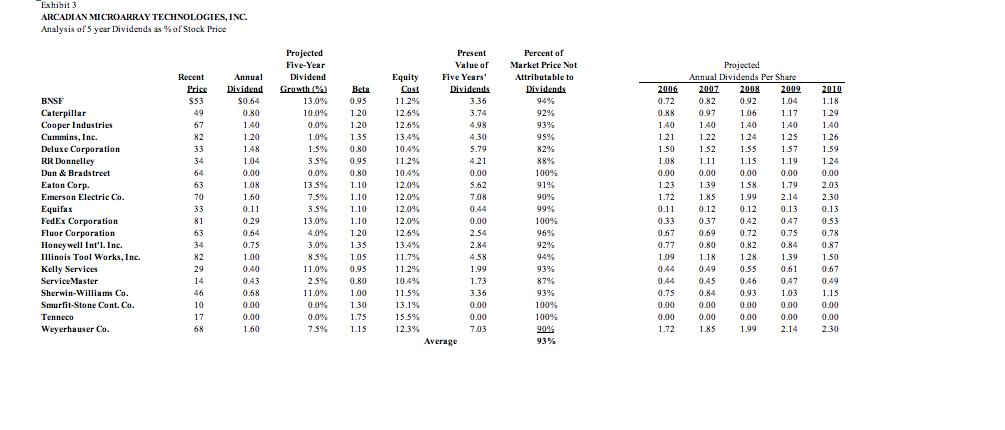
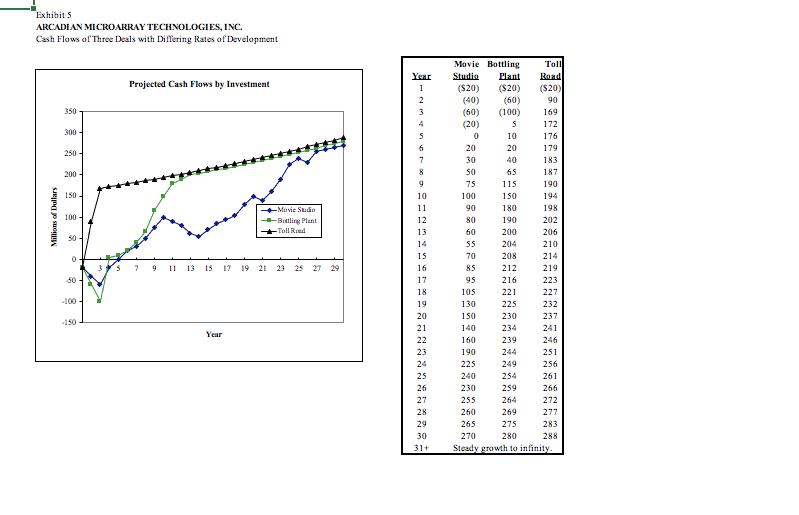
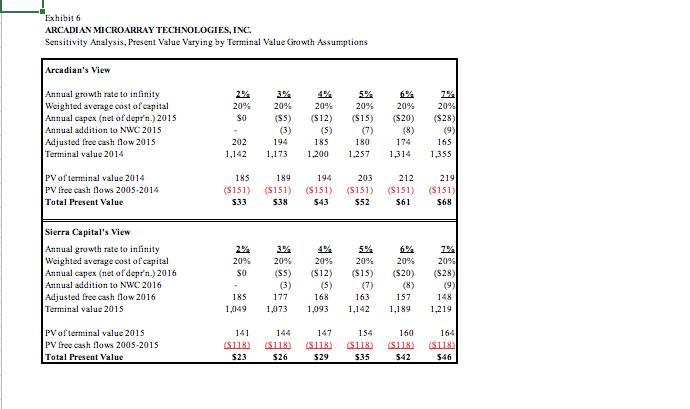
Exhibit 1 ARCADIAN MICROARRAY TECHNOLOGIES, INC. Cash Flow Forecast by Arcadian Management Actual INCOME STATEMENT 2004 2005 2006 2007 2008 2009 2010 2011 2012 2013 2014 Sales Clinical microarrays $0 $1 $15 $56 $107 $181 $249 $274 $282 $285 $289 Research microarrays 2 12 28 45 75 110 135 165 190 210 225 Royalties and other revenue 0 0 2 13 52 106 146 166 174 186 189 Human therapeutics 0 0 0 0 8 57 171 250 330 352 362 Total sales 2 13 45 114 242 454 701 855 976 1,033 1,065 Cost of sales 7 10 21 41 84 159 246 322 335 350 361 Gross profits Contract revenue (5) 3 24 73 158 295 455 533 641 683 704 16 21 23 15 12 4 3 3 3 3 3 Operating expenses Research & development 14 20 24 18 21 21 32 43 51 52 50 Selling, general & admin. 12 15 24 45 93 176 259 323 369 372 349 Total expenses 26 35 48 63 114 197 291 366 420 424 399 Other income 3 2 2 0 (3) (10) (25) (38) (43) (37) (20) Income before taxes (12) (9) 1 25 53 92 142 132 181 225 288 Taxes 0 0 S 9 19. 32 57 76 89 90 85 Net income (512) (59) (54) $16 $35 $60 $85 $56 $92 $135 $203 FREE CASH FLOW Net income (512) (59) (54) $16 $35 $60 $85 $56 $92 $135 $203 Noncash items 0 1 2 2 6 10 18 19 15 8 (1) Working capital (4) (8) (12) (22) (63) (101) (118) (100) (61) 1 39 Capital expenditures (15) (6) (5) (23) (53) (93) (111) (98) (66) (10) (10) Free cash flow ($31) (522) (519) ($27) (576) ($124) ($126) ($123) (520) $134 $231 Exhibit 2 ARCADIAN MICROARRAY TECHNOLOGIES, INC. Cash Flow Forecast by Sierra Capital Actual INCOME STATEMENT 2004 2005 2006 2007 2008 2009 2010 2011 2012 2013 2014 2015 Sales Clinical microarrays SO $0 $2 $11 $22 $36 $56 $71 $85 $95 $106 $114 Research microarrays 2 4 11 22 40 59 89 135 145 160 185 199 Royalties and other revenue 0 1 4 7 12 15 25 50 60 75 91 105 Human therapeutics 0 0 0 0 0 0 0 14 56 801 110 140 Total sales Cost of sales 27 5 17 40 74 110 170 270 346 410 492 558 17 20 25 39 54 72 96 124 142 154 160 Gross profits Contract revenue (5) 16 22 (12) (3) 15 35 56 98 174 222 268 338 398 22 22 15 12 4 4 4 4 4 4 4 Operating expenses Research & development 14 23 25 27 29 33 37 44 52 53 54 58 Selling, general & admin. 12 21 25 32 44 64 87 104 127 138 136 136 Total expenses 26 44 50 59 73 96 124 147 179 191 191 194 Other income 3 0 0 1 (1) (2) (2) (3) (2) 0 0 3 Income before taxes (12) (34) (31) (29) (27) (38) (24) 28 45 80 152 210 Taxes 0 0 (0) 1 4 (13) 4 11 15 27 39 48 Net income (512) (534) (531) (530) (531) ($25) (528) $17 $30 $53 $112 $162 FREE CASH FLOW Net income ($12) ($34) ($31) ($30) ($31) ($25) ($28) $17 $30 $53 $112 $162 Noncash items 2 3 3 3 4 6 8 10 14 18 20 23 Working capital (6) (6) (6) (7) (14) (17) (19) (20) (28) (16) (6) (6) Capital expenditures (15) (9) (9) (9) (10) (11) (15) (18) (24) (27) (28) (30) Free cash flow (531) (546) (543) (543) ($51) (547) (554) ($11) (58) $28 598 $149 Exhibit 3 ARCADIAN MICROARRAY TECHNOLOGIES, INC. Analysis of 5 year Dividends as % of Stock Price Projected Present Percent of Five-Year Value of Market Price Not Projected Recent Annual Dividend Equity Five Years' Attributable to Annual Dividends Per Share Price Dividend Growth (%) Beta Cost Dividends Dividends 2006 2007 2008 2009 2010 BNSF $53 $0.64 13.0% 0.95 11.2% 3.36 94% 0.72 0.82 0.92 1.04 1.18 Caterpillar 49 0.80 10.0% 1.20 12.6% 3.74 92% 0.88 0.97 1.06 1.17 1.29 Cooper Industries 67 1.40 0.0% 1.20 12.6% 4.98 93% 1.40 1.40 1.40 1.40 1.40 Cummins, Inc. 82 1.20 1.0% 1.35 13.4% 4.30 95% 1.21 1.22 1.24 1.25 1.26 Deluxe Corporation 33 1.48 1.5% 0.80 10.4% 5.79 82% 1.50 1.52 1.55 1.57 1.59 RR Donnelley 34 1.04 3.5% 0.95 11.2% 4.21 88% 1.08 1.11 1.15 1.19. 1.24 Dun & Bradstreet 64 0.00 0.0% 0.80 10.4% 0.00 100% 0.00 0.00 0.00 0.00 0.00 Eaton Corp. 63 1.08 13.5% 1.10 12.0% 5.62 91% 1.23 1.39 1.58 1.79 2.03 Emerson Electric Co. 70 1.60 7.5% 1.10 12.0% 7.08 90% 1.72 1.85 1.99 2.14. 2.30 Equifax 33 0.11 3.5% 1.10 12.0% 0.44 99% 0.11 0.12 0.12 0.13 0.13 FedEx Corporation 81 0.29 13.0% 1.10 12.0% 0.00 100% 0.33 0.37 0.42 0.47 0.53 Fluor Corporation 63 0.64 4.0% 1.20 12.6% 2.54 96% 0.67 0.69 0.72 0.75 0.78 Honeywell Int'l. Inc. 34 0.75 3.0% 1.35 13.4% 2.84 92% 0.77 0.80 0.82 0.84 0.87 Illinois Tool Works, Inc. 82 1.00 8.5% 1.05 11.7% 4.58 94% 1.09 1.18 1.28 1.39 1.50 Kelly Services 29 0.40 11.0% 0.95 11.2% 1.99 93% 0.44 0.49 0.55 0.61 0.67 ServiceMaster 14 0.43 2.5% 0.80 10.4% 1.73 87% 0.44 0.45 0.46 0.47 0.49 Sherwin-Williams Co. 46 0.68 11.0% 1.00 11.5% 3.36 93% 0.75 0.84 0.93 1.03 1.15 Smurfit-Stone Cont. Co. 10 0.00 0.0% 1.30 13.1% 0.00 100% 0.00 0.00 0.00 0.00 0.00 Tenneco 17 0.00 0.0% 1.75 15.5% 0.00 100% 0.00 0.00 0.00 0.00 0.00 Weyerhauser Co. 68 1.60 7.5% 1.15 12.3% 7.03 90% 1.72 1.85 1.99 2.14 2.30 Average 93% Millions of Dollars Exhibit 5 ARCADIAN MICROARRAY TECHNOLOGIES, INC. Cash Flows of Three Deals with Differing Rates of Development Movie Bottling Toll Year Studio Plant Road Projected Cash Flows by Investment 1 ($20) ($20) ($20) 2 (40) (60) 90 350 300 250- 200- 3 (60) (100) 169 4 (20) S 172 0 10 176 6 20 20 179 7 30 40 183 8 50 65 187 9 75 115 190 150 10 100 150 194 -Movie Studio 11 90 180 198 100- 50 Battling Plant 12 80 190 202 -Toll Road 13 60 200 206 14 55 204 210 0 15 70 208 214 5 9 11 13 15 17 19 21 23 25 27 29 16 85 212 219 50 17 95 216 223 18 105 221 227 -100 -150 19 130 225 232 20 150 230 237 21 140 234 241 Year 22 160 239 246 23 190 244 251 24 225 249 256 25 240 254 261 26 230 259 266 27 255 264 272 28 260 269 277 29 265 275 283 30 270 280 288 31+ Steady growth to infinity. Exhibit 6 ARCADIAN MICROARRAY TECHNOLOGIES, INC. Sensitivity Analysis, Present Value Varying by Terminal Value Growth Assumptions Arcadian's View Annual growth rate to infinity 2% 3% 4% 5% 6% 7% Weighted average cost of capital 20% 20% 20% 20% 20% 20% Annual capex (net of depr'n.) 2015 $0 ($5) ($12) ($15) ($20) ($28) Annual addition to NWC 2015 (3) (5) (7) (8) (9) Adjusted free cash flow 2015 202 194 185 180 174 165 Terminal value 2014 1,142 1,173 1,200 1,257 1,314 1,355 PV of terminal value 2014 185 189 194 203 212 219 PV free cash flows 2005-2014 ($151) ($151) ($151) ($151) ($151) ($151) Total Present Value $33 $38 $43 $52 $61 $68 Sierra Capital's View Annual growth rate to infinity 2% 3% 4% 5% 6% 7% Weighted average cost of capital 20% 20% 20% 20% 20% 20% Annual capex (net of depr'n.) 2016 (SS) ($12) ($15) ($20) ($28) Annual addition to NWC 2016 (3) (5) (7) (8) (9) Adjusted free cash flow 2016 185 177 168 163 157 148 Terminal value 2015 1,049 1,073 1,093 1,142 1,189 1,219 PV of terminal value 2015 141 144 147 154 160 164 PV free cash flows 2005-2015 ($118) ($118) ($118) (S118) ($118) ($118) Total Present Value $23 $26 529 $35 542 $46 Exhibit 1 ARCADIAN MICROARRAY TECHNOLOGIES, INC. Cash Flow Forecast by Arcadian Management Actual INCOME STATEMENT 2004 2005 2006 2007 2008 2009 2010 2011 2012 2013 2014 Sales Clinical microarrays $0 $1 $15 $56 $107 $181 $249 $274 $282 $285 $289 Research microarrays 2 12 28 45 75 110 135 165 190 210 225 Royalties and other revenue 0 0 2 13 52 106 146 166 174 186 189 Human therapeutics 0 0 0 0 8 57 171 250 330 352 362 Total sales 2 13 45 114 242 454 701 855 976 1,033 1,065 Cost of sales 7 10 21 41 84 159 246 322 335 350 361 Gross profits Contract revenue (5) 3 24 73 158 295 455 533 641 683 704 16 21 23 15 12 4 3 3 3 3 3 Operating expenses Research & development 14 20 24 18 21 21 32 43 51 52 50 Selling, general & admin. 12 15 24 45 93 176 259 323 369 372 349 Total expenses 26 35 48 63 114 197 291 366 420 424 399 Other income 3 2 2 0 (3) (10) (25) (38) (43) (37) (20) Income before taxes (12) (9) 1 25 53 92 142 132 181 225 288 Taxes 0 0 S 9 19. 32 57 76 89 90 85 Net income (512) (59) (54) $16 $35 $60 $85 $56 $92 $135 $203 FREE CASH FLOW Net income (512) (59) (54) $16 $35 $60 $85 $56 $92 $135 $203 Noncash items 0 1 2 2 6 10 18 19 15 8 (1) Working capital (4) (8) (12) (22) (63) (101) (118) (100) (61) 1 39 Capital expenditures (15) (6) (5) (23) (53) (93) (111) (98) (66) (10) (10) Free cash flow ($31) (522) (519) ($27) (576) ($124) ($126) ($123) (520) $134 $231 Exhibit 2 ARCADIAN MICROARRAY TECHNOLOGIES, INC. Cash Flow Forecast by Sierra Capital Actual INCOME STATEMENT 2004 2005 2006 2007 2008 2009 2010 2011 2012 2013 2014 2015 Sales Clinical microarrays SO $0 $2 $11 $22 $36 $56 $71 $85 $95 $106 $114 Research microarrays 2 4 11 22 40 59 89 135 145 160 185 199 Royalties and other revenue 0 1 4 7 12 15 25 50 60 75 91 105 Human therapeutics 0 0 0 0 0 0 0 14 56 801 110 140 Total sales Cost of sales 27 5 17 40 74 110 170 270 346 410 492 558 17 20 25 39 54 72 96 124 142 154 160 Gross profits Contract revenue (5) 16 22 (12) (3) 15 35 56 98 174 222 268 338 398 22 22 15 12 4 4 4 4 4 4 4 Operating expenses Research & development 14 23 25 27 29 33 37 44 52 53 54 58 Selling, general & admin. 12 21 25 32 44 64 87 104 127 138 136 136 Total expenses 26 44 50 59 73 96 124 147 179 191 191 194 Other income 3 0 0 1 (1) (2) (2) (3) (2) 0 0 3 Income before taxes (12) (34) (31) (29) (27) (38) (24) 28 45 80 152 210 Taxes 0 0 (0) 1 4 (13) 4 11 15 27 39 48 Net income (512) (534) (531) (530) (531) ($25) (528) $17 $30 $53 $112 $162 FREE CASH FLOW Net income ($12) ($34) ($31) ($30) ($31) ($25) ($28) $17 $30 $53 $112 $162 Noncash items 2 3 3 3 4 6 8 10 14 18 20 23 Working capital (6) (6) (6) (7) (14) (17) (19) (20) (28) (16) (6) (6) Capital expenditures (15) (9) (9) (9) (10) (11) (15) (18) (24) (27) (28) (30) Free cash flow (531) (546) (543) (543) ($51) (547) (554) ($11) (58) $28 598 $149 Exhibit 3 ARCADIAN MICROARRAY TECHNOLOGIES, INC. Analysis of 5 year Dividends as % of Stock Price Projected Present Percent of Five-Year Value of Market Price Not Projected Recent Annual Dividend Equity Five Years' Attributable to Annual Dividends Per Share Price Dividend Growth (%) Beta Cost Dividends Dividends 2006 2007 2008 2009 2010 BNSF $53 $0.64 13.0% 0.95 11.2% 3.36 94% 0.72 0.82 0.92 1.04 1.18 Caterpillar 49 0.80 10.0% 1.20 12.6% 3.74 92% 0.88 0.97 1.06 1.17 1.29 Cooper Industries 67 1.40 0.0% 1.20 12.6% 4.98 93% 1.40 1.40 1.40 1.40 1.40 Cummins, Inc. 82 1.20 1.0% 1.35 13.4% 4.30 95% 1.21 1.22 1.24 1.25 1.26 Deluxe Corporation 33 1.48 1.5% 0.80 10.4% 5.79 82% 1.50 1.52 1.55 1.57 1.59 RR Donnelley 34 1.04 3.5% 0.95 11.2% 4.21 88% 1.08 1.11 1.15 1.19. 1.24 Dun & Bradstreet 64 0.00 0.0% 0.80 10.4% 0.00 100% 0.00 0.00 0.00 0.00 0.00 Eaton Corp. 63 1.08 13.5% 1.10 12.0% 5.62 91% 1.23 1.39 1.58 1.79 2.03 Emerson Electric Co. 70 1.60 7.5% 1.10 12.0% 7.08 90% 1.72 1.85 1.99 2.14. 2.30 Equifax 33 0.11 3.5% 1.10 12.0% 0.44 99% 0.11 0.12 0.12 0.13 0.13 FedEx Corporation 81 0.29 13.0% 1.10 12.0% 0.00 100% 0.33 0.37 0.42 0.47 0.53 Fluor Corporation 63 0.64 4.0% 1.20 12.6% 2.54 96% 0.67 0.69 0.72 0.75 0.78 Honeywell Int'l. Inc. 34 0.75 3.0% 1.35 13.4% 2.84 92% 0.77 0.80 0.82 0.84 0.87 Illinois Tool Works, Inc. 82 1.00 8.5% 1.05 11.7% 4.58 94% 1.09 1.18 1.28 1.39 1.50 Kelly Services 29 0.40 11.0% 0.95 11.2% 1.99 93% 0.44 0.49 0.55 0.61 0.67 ServiceMaster 14 0.43 2.5% 0.80 10.4% 1.73 87% 0.44 0.45 0.46 0.47 0.49 Sherwin-Williams Co. 46 0.68 11.0% 1.00 11.5% 3.36 93% 0.75 0.84 0.93 1.03 1.15 Smurfit-Stone Cont. Co. 10 0.00 0.0% 1.30 13.1% 0.00 100% 0.00 0.00 0.00 0.00 0.00 Tenneco 17 0.00 0.0% 1.75 15.5% 0.00 100% 0.00 0.00 0.00 0.00 0.00 Weyerhauser Co. 68 1.60 7.5% 1.15 12.3% 7.03 90% 1.72 1.85 1.99 2.14 2.30 Average 93% Millions of Dollars Exhibit 5 ARCADIAN MICROARRAY TECHNOLOGIES, INC. Cash Flows of Three Deals with Differing Rates of Development Movie Bottling Toll Year Studio Plant Road Projected Cash Flows by Investment 1 ($20) ($20) ($20) 2 (40) (60) 90 350 300 250- 200- 3 (60) (100) 169 4 (20) S 172 0 10 176 6 20 20 179 7 30 40 183 8 50 65 187 9 75 115 190 150 10 100 150 194 -Movie Studio 11 90 180 198 100- 50 Battling Plant 12 80 190 202 -Toll Road 13 60 200 206 14 55 204 210 0 15 70 208 214 5 9 11 13 15 17 19 21 23 25 27 29 16 85 212 219 50 17 95 216 223 18 105 221 227 -100 -150 19 130 225 232 20 150 230 237 21 140 234 241 Year 22 160 239 246 23 190 244 251 24 225 249 256 25 240 254 261 26 230 259 266 27 255 264 272 28 260 269 277 29 265 275 283 30 270 280 288 31+ Steady growth to infinity. Exhibit 6 ARCADIAN MICROARRAY TECHNOLOGIES, INC. Sensitivity Analysis, Present Value Varying by Terminal Value Growth Assumptions Arcadian's View Annual growth rate to infinity 2% 3% 4% 5% 6% 7% Weighted average cost of capital 20% 20% 20% 20% 20% 20% Annual capex (net of depr'n.) 2015 $0 ($5) ($12) ($15) ($20) ($28) Annual addition to NWC 2015 (3) (5) (7) (8) (9) Adjusted free cash flow 2015 202 194 185 180 174 165 Terminal value 2014 1,142 1,173 1,200 1,257 1,314 1,355 PV of terminal value 2014 185 189 194 203 212 219 PV free cash flows 2005-2014 ($151) ($151) ($151) ($151) ($151) ($151) Total Present Value $33 $38 $43 $52 $61 $68 Sierra Capital's View Annual growth rate to infinity 2% 3% 4% 5% 6% 7% Weighted average cost of capital 20% 20% 20% 20% 20% 20% Annual capex (net of depr'n.) 2016 (SS) ($12) ($15) ($20) ($28) Annual addition to NWC 2016 (3) (5) (7) (8) (9) Adjusted free cash flow 2016 185 177 168 163 157 148 Terminal value 2015 1,049 1,073 1,093 1,142 1,189 1,219 PV of terminal value 2015 141 144 147 154 160 164 PV free cash flows 2005-2015 ($118) ($118) ($118) (S118) ($118) ($118) Total Present Value $23 $26 529 $35 542 $46
Expert Answer:

Related Book For 
Fundamentals of Corporate Finance
ISBN: 978-0133400694
1st canadian edition
Authors: Jonathan Berk, Peter DeMarzo, Jarrad Harford, David A. Stangeland, Andras Marosi
Posted Date:
Students also viewed these finance questions
-
Use the attached "words.txt" file to store the words along with their ranks in an AVL tree. Then provide the user the option to search for any word. If the word exists the program displays the rank...
-
(10 points) Given that ry + xy = 1. 1. Find a solution of the differential equation that satisfies the initial condition y(1) = 10. Answer: y = 2. Find a solution of the differential equation that...
-
People who earn a higher salary can afford more goods, including health care. However, according to Grossman, they will choose a higher desired health stock. Why is this so, according to the model?
-
Calculate the earnings per share of common stock for 2016 and 2015. Austin, Ind Comparative Income Statement Years Ended December 31, 2016 and 2015 Amounts 2016 2015 Sales Less Sales Returns and...
-
a. At what layers do wireless LANs operate? 1a.) Wireless network standards operate at ________. a. The data link layer b. The Internet layer c. Both A and B d. Neither A nor B b. Do wireless LAN...
-
Derive an equation for the lines of constant declination in a sun-path diagram, for example, Figure 5.10d. Check your equation by plotting a few declination lines on a piece of polar coordinate graph...
-
Operating leverage Color Rugs is holding a two-week carpet sale at Jerrys Club, a local warehouse store. Color Rugs plans to sell carpets for $500 each. The company will purchase the carpets from a...
-
Ali & Co. is a manufacturing business. The following information relates to the year ended 30 April 2005. Direct material Direct labour Factory overheads Work in progress, 1 May 2004 Work in...
-
How can distributing free masks encourage people to wear masks in countries like Barbados?
-
Green light has a wavelength of \(530 \mathrm{~nm}\) in air. What are the frequency and wavelength of this light in flint glass (index of refraction \(n=1.65\) )? (index of refraction \(n=1.65\) )?
-
Chase Publishing was disappointed with the financial textbook and decided to purchase the trademark from a well-known record store for $\$ 250,000$. How can the cost of the trademark be accounted for...
-
Chase Publishing Company purchased the copyright to a financial textbook for $\$ 25,000$. Although the author thought the book would serve academia for 10 years, the reality is that the typical life...
-
Blair Company has $\$ 5$ million in total assets. The company's assets are financed with $\$ 1$ million of debt and $\$ 4$ million of common equity. The company's income statement is summarized...
-
An advanced engineering computer was purchased for $\$ 22,750$ and its expected life is 4 years. It is estimated the company could sell the computer for $\$ 500$ after 5 years. Compute and compare...
-
Bacchante Co has a capital structure as follows: Bank loans Loan notes Ordinary shares Cost of capital BV MV $m $m 5 5 6 8 18 39 % 9 12 15 The company's current operations are carried out from two...
-
Vince, Inc. has developed and patented a new laser disc reading device that will be marketed internationally. Which of the following factors should Vince consider in pricing the device? I. Quality of...
-
What do you need to know to compute a cash flow's present or future value?
-
What types of lease options would raise the amount of the lease payment?
-
What types of additional costs does a firm incur when accessing external capital?
-
Using Rayeigh's method, determine the fundamental natural frequency of the system shown in Fig. 8.42. Disc, mass moment of inertia 5 kg-m Steel shaft, dia. 5 cm + O 0.8 m -0.2 m- FIGURE 8.42...
-
Solve Problem 8.73 using the Rayleigh-Ritz method with the mode shape \[U(x)=c_{1} \sin \frac{\pi x}{2 l}+c_{2} \sin \frac{3 \pi x}{2 l}\]
-
Find the first two natural frequencies of a fixed-fixed uniform string of mass density \(ho\) per unit length stretched between \(x=0\) and \(x=l\) with an initial tension \(P\). Assume the...

Study smarter with the SolutionInn App