

Imagine that your boss gives you a large dataset which contains trip information of New York City
Question:
Imagine that your boss gives you a large dataset which contains trip information of New York City Taxi and Limousine Commission (TLC). You are asked to provide summaries of the most common trips, as well as information related to fares and traffic. This information might help in positioning taxis depending on the demand at each location. You are provided with a Jupyter notebook (q1.ipynb) file which you will complete using PySpark using the provided Docker image.
Note: 1. Regular PySpark Dataframe Operations and PySpark SQL operations can be used. 2. If you re-run cells, remember to restart the kernel to clear the Spark context, otherwise an existing Spark context may cause errors. 3. Be sure to save your work often! If you do not see your notebook in Jupyter, then double check that the file is present in the folder and that your Docker has been set up correctly. If, after checking both, the file still does not appear in Jupyter then you can still move forward by clicking the "upload" button in the Jupyter notebook and uploading the file - however, if you use this approach, then your file will not be saved to disk when you save in Jupyter, so you would need to download your work by going to File > Download as... > Notebook (.ipynb), so be sure to download often to save your work!
Tasks You will use the yellow_tripdata_2019-01_short.csv dataset, a modified record of the NYC Green Taxi trips and includes information about the pick-up and drop-off dates/times, pick-up and drop-off locations, trip distances, fare amounts, payment types, and driver-reported passenger counts. When processing the data or performing calculations, do not round any values, unless specifically instructed to.
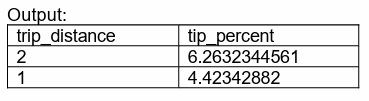
c. [4 pts] You will be modifying the function distance_with_most_tip . Filter the data for trips having fares (fare_amount) greater than $2.00 and a trip distance (trip_distance) greater than 0. Calculate the tip percent (tip_amount * 100 / fare_amount) for each trip. Round all trip distances up to the closest mile and find the average tip_percent for each trip_distance. Sort the result in descending order of tip_percent to obtain the top 15 trip distances which tip the most generously. Rename the column for rounded trip distances to trip_distance, and the column for average tip percents tip_percent .
def distance_with_most_tip(df):
'''
input: df a dataframe
output: df a dataframe with following columns:
- trip_distance
- tip_percent
trip_percent is the percent of tip out of fare_amount
'''
# START YOUR CODE HERE ---------
# END YOUR CODE HERE -----------
return df
Expert Answer:


Principles of Information Systems
ISBN: 978-0324665284
9th edition
Authors: Ralph M. Stair, George W. Reynolds
