In Figure b, the teen employment rate dropped from 31 percent in the 12 months before the
Question:
In Figure b, the teen employment rate dropped from 31 percent in the 12 months before the minimum-wage increase in July 2007 to about 23 percent for several years after the July 2009 hike. Prime-age high school graduates are our control group. Their employment rate fell from 71.5 percent before the minimum-wage increase in 2007 to about 69 percent after the 2009 hike. But a 1 percentage point change in the employment rate of the control group translates to a 1.5 percentage point change in the employment rate of teens.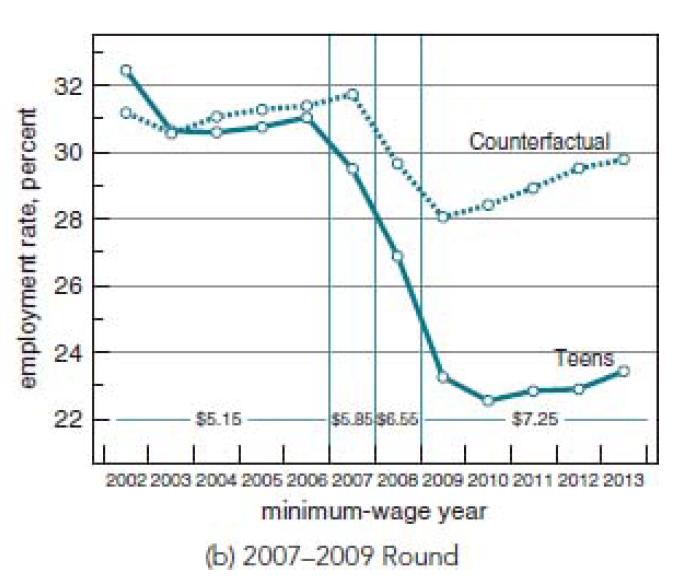
a) What’s the before-and-after estimate of the effect of these minimum-wage hikes on the teen employment rate?
b) Use the evidence on the employment rates of the control group to predict how the employment rate of teens would have evolved if not for the minimum-wage hikes. In particular, the teen employment rate would have fallen _______ percentage points without the minimum wage hikes in 2007–2009.
c) Combine your answers to (a) and (b) to produce a difference indifference estimate of the effect of the 2007–2009 minimum-wage.
Expert Answer:
a Based on the estimates of the overall teen employment rate before the minimum wage increase in Jul... View the full answer