

In this lab activity, we will use Microsoft Excel to find summary statistics for a data...
Fantastic news! We've Found the answer you've been seeking!
Question:
Transcribed Image Text:
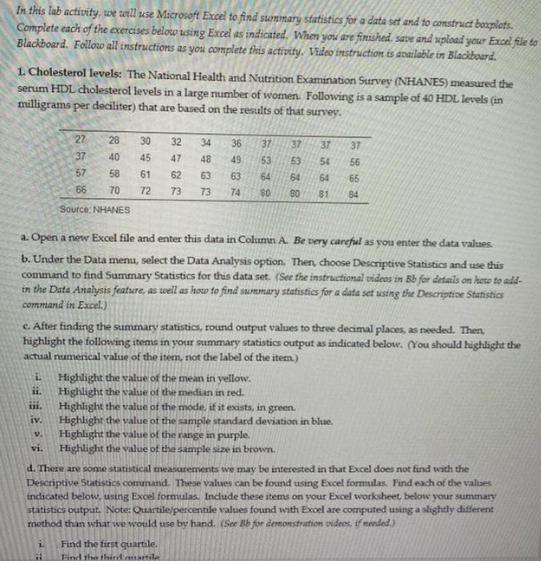
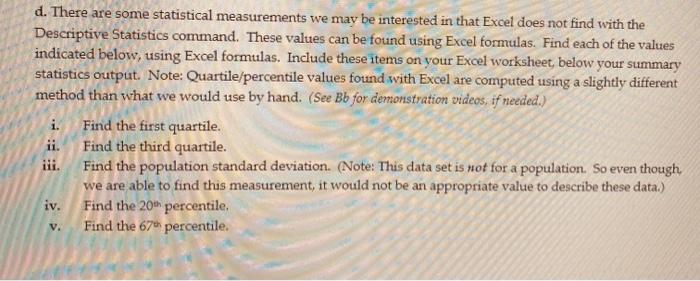
In this lab activity, we will use Microsoft Excel to find summary statistics for a data set and to construct boxplets. Complete each of the exercises below using Excel as indicated. When you are finished, save and upload your Excel file to Blackboard. Follow all instructions as you complete this activity. Video instruction is available in Blackboard. 1. Cholesterol levels: The National Health and Nutrition Examination Survey (NHANES) measured the serum HDL cholesterol levels in a large number of women. Following is a sample of 40 HDL levels (in milligrams per deciliter) that are based on the results of that survey. 27 28 30 32 34 36 37 40 45 47 48 49 57 58 61 62 63 63 66 70 72 73 73 74 5238 37 37 37 53 54 56 64 64 64 65 80 81 84 Source: NHANES a. Open a new Excel file and enter this data in Column A. Be very careful as you enter the data values. b. Under the Data menu, select the Data Analysis option. Then, choose Descriptive Statistics and use this command to find Summary Statistics for this data set. (See the instructional videos in Bb for details on here to add- in the Data Analysis feature, as well as how to find summary statistics for a data set using the Descriptive Statistics command in Excel.) c. After finding the summary statistics, round output values to three decimal places, as needed. Then, highlight the following items in your summary statistics output as indicated below. (You should highlight the actual numerical value of the item, not the label of the item) L Highlight the value of the mean in yellow. ii. Highlight the value of the median in red. 111. Highlight the value of the mode, if it exists, in green. iv. Highlight the value of the sample standard deviation in blue. v. Highlight the value of the range in purple. vi. Highlight the value of the sample size in brown. d. There are some statistical measurements we may be interested in that Excel does not find with the Descriptive Statistics command. These values can be found using Excel formulas. Find each of the values indicated below, using Excel formulas. Include these items on your Excel worksheet, below your summary statistics output. Note: Quartile/percentile values found with Excel are computed using a slightly different method than what we would use by hand. (See Bb for demonstration videos, if mended) Find the first quartile. Find the thiril martile d. There are some statistical measurements we may be interested in that Excel does not find with the Descriptive Statistics command. These values can be found using Excel formulas. Find each of the values indicated below, using Excel formulas. Include these items on your Excel worksheet, below your summary statistics output. Note: Quartile/percentile values found with Excel are computed using a slightly different method than what we would use by hand. (See Bb for demonstration videos, if needed.) i. Find the first quartile. ii. Find the third quartile. iii. Find the population standard deviation. (Note: This data set is not for a population. So even though, we are able to find this measurement, it would not be an appropriate value to describe these data.) iv. Find the 20th percentile. v. Find the 67th percentile. In this lab activity, we will use Microsoft Excel to find summary statistics for a data set and to construct boxplets. Complete each of the exercises below using Excel as indicated. When you are finished, save and upload your Excel file to Blackboard. Follow all instructions as you complete this activity. Video instruction is available in Blackboard. 1. Cholesterol levels: The National Health and Nutrition Examination Survey (NHANES) measured the serum HDL cholesterol levels in a large number of women. Following is a sample of 40 HDL levels (in milligrams per deciliter) that are based on the results of that survey. 27 28 30 32 34 36 37 40 45 47 48 49 57 58 61 62 63 63 66 70 72 73 73 74 5238 37 37 37 53 54 56 64 64 64 65 80 81 84 Source: NHANES a. Open a new Excel file and enter this data in Column A. Be very careful as you enter the data values. b. Under the Data menu, select the Data Analysis option. Then, choose Descriptive Statistics and use this command to find Summary Statistics for this data set. (See the instructional videos in Bb for details on here to add- in the Data Analysis feature, as well as how to find summary statistics for a data set using the Descriptive Statistics command in Excel.) c. After finding the summary statistics, round output values to three decimal places, as needed. Then, highlight the following items in your summary statistics output as indicated below. (You should highlight the actual numerical value of the item, not the label of the item) L Highlight the value of the mean in yellow. ii. Highlight the value of the median in red. 111. Highlight the value of the mode, if it exists, in green. iv. Highlight the value of the sample standard deviation in blue. v. Highlight the value of the range in purple. vi. Highlight the value of the sample size in brown. d. There are some statistical measurements we may be interested in that Excel does not find with the Descriptive Statistics command. These values can be found using Excel formulas. Find each of the values indicated below, using Excel formulas. Include these items on your Excel worksheet, below your summary statistics output. Note: Quartile/percentile values found with Excel are computed using a slightly different method than what we would use by hand. (See Bb for demonstration videos, if mended) Find the first quartile. Find the thiril martile d. There are some statistical measurements we may be interested in that Excel does not find with the Descriptive Statistics command. These values can be found using Excel formulas. Find each of the values indicated below, using Excel formulas. Include these items on your Excel worksheet, below your summary statistics output. Note: Quartile/percentile values found with Excel are computed using a slightly different method than what we would use by hand. (See Bb for demonstration videos, if needed.) i. Find the first quartile. ii. Find the third quartile. iii. Find the population standard deviation. (Note: This data set is not for a population. So even though, we are able to find this measurement, it would not be an appropriate value to describe these data.) iv. Find the 20th percentile. v. Find the 67th percentile.
Expert Answer:

Related Book For 
Posted Date:
Students also viewed these mathematics questions
-
This assignment requires you to complete the 2022 tax reporting for a fictional woman named Anna Smith. Question 1 T1 - step 4 - line 66 This is Anna's taxable income Answer: Question 2 T1 - step...
-
The following additional information is available for the Dr. Ivan and Irene Incisor family from Chapters 1-5. Ivan's grandfather died and left a portfolio of municipal bonds. In 2012, they pay Ivan...
-
Use the formula A= P(1+) to find the total amount of money accumulated for an initial investment $600 at 8% compounded semiannually after 7 years. Round to the nearest cent (in dollars and cents)....
-
Adams, Everett, and Chapman each have a $50,000 Capital balance. They share profits and losses as follows: 25 percent to Adams, 50 percent to Everett, and 25 percent to Chapman. Suppose Chapman is...
-
What are the strength and direction of the electric field at the position indicated by the dot in FIGURE EX23.3? Specify the direction as an angle above or below horizontal. 3.0 nC (+ 5.0 cm 5.0 cm...
-
What advantages would fuzzy expert systems have over traditional expert systems.Would they have any disadvantages?
-
Your comparison of the gross margin percent for Jones Drugs for the years 2008 through 2011 indicates a significant decline. This is shown by the following information: A discussion with Marilyn...
-
Sheridan Company is considering a long-term investment project called ZIP. ZIP will require an investment of $117,200. It will have a useful life of 4 years and no salvage value. Annual revenues...
-
Ivey Company prepared the following budgeted income statement for the first quarter of 2016: Ivey Company is considering two options. Option 1 is to increase advertising by $ 1,000 per month. Option...
-
Determine the concentration of the following solutions: a) KOH: pH = 11.89 b) Ca(OH) 2 : pH = 11.68
-
The net operating cycle is: A. inversely related to a companys need for liquidity. B. the length of time it takes for an investment in inventory to be returned from collected accounts. C. the sum of...
-
A measure of the extent to which a company is able to satisfy its short-term obligations is referred to as: A. a liquidity ratio. B. an activity ratio. C. a financial leverage ratio.
-
The difference between a companys operating cycle and its net operating cycle is: A. the number of days that it takes, on average, for the company to sell its inventory. B. the number of days that it...
-
Which of the following best describes the relationship between the current ratio and the cash ratio? A. The current ratio and the cash ratio should not bear any relation to one another. B. The...
-
According to the pecking order theory: A. new debt is preferable to new equity. B. new debt is preferable to internally generated funds. C. new equity is always preferable to other sources of capital.
-
In your future endeavors, how do you think you might find yourself applying statistical concepts Under what conditions might you find yourself creating an Excel pie chart, running a correlation, or...
-
Draw the major product for each of the following reactions: (a) (b) (c) 1) 9-BBN 2) H2O2, NaOH 1) Disiamylborane 2) H20, NaOH
-
The article Calibration of an FTIR Spectrometer (P. Pankratz, Statistical Case Studies for Industrial and Process Improvement, SIAM-ASA, 1997: 1938) describes the use of a spectrometer to make five...
-
True or false: In any boxplot, a. The length of the whiskers is equal to 1.5 IQR, where IQR is the interquartile range. b. The length of the whiskers may be greater than 1.5 IQR, where IQR is the...
-
Refer to Exercise 4. The total number of assemblies that fail to meet specifications is X + Y. a. Find μ X+Y . b. Find Ï X+Y . c. Find P(X + Y = 3). Refer to Exercise 4. y 0.15...
-
What quality systems and standards exist in your organisation to 1) ensure quality across the project and 2) ensure quality within the products and services produced by your projects?
-
Which types of tools would be useful for investigating the root cause of a problem?
-
How can a run chart be used within a project environment?

Study smarter with the SolutionInn App