

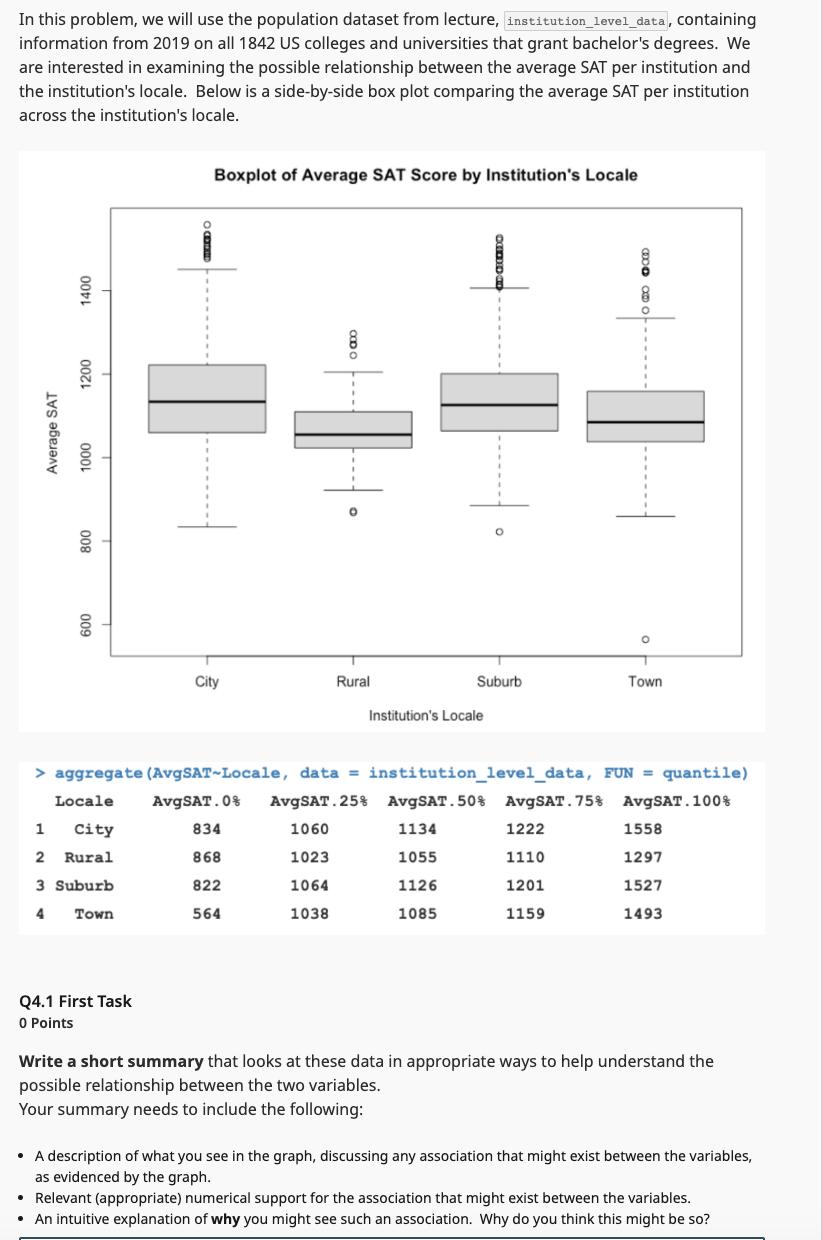
In this problem, we will use the population dataset from lecture, institution_level_data, containing information from 2019...
Fantastic news! We've Found the answer you've been seeking!
Question:
Expert Answer:
Description of the Graph In the box plot we can observe several key features 1 Center of Distributions The horizontal lines within each box represent the median 50th percentile average SAT score for e... View the full answer

Related Book For 

Applied Regression Analysis and Other Multivariable Methods
ISBN: 978-1285051086
5th edition
Authors: David G. Kleinbaum, Lawrence L. Kupper, Azhar Nizam, Eli S. Rosenberg
Posted Date:
