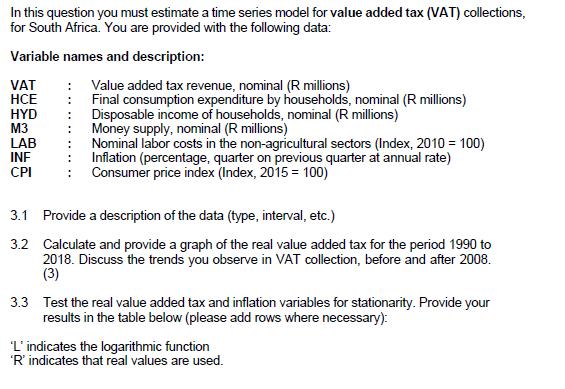
In this question you must estimate a time series model for value added tax (VAT) collections,...
Fantastic news! We've Found the answer you've been seeking!
Question:
Transcribed Image Text:
In this question you must estimate a time series model for value added tax (VAT) collections, for South Africa. You are provided with the following data: Variable names and description: : Value added tax revenue, nominal (R millions) Final consumption expenditure by households, nominal (R millions) Disposable income of households, nominal (R millions) Money supply, nominal (R millions) VAT HCE : HYD : : M3 LAB : : INF CPI Nominal labor costs in the non-agricultural sectors (Index, 2010 = 100) Inflation (percentage, quarter on previous quarter at annual rate) : Consumer price index (Index, 2015 = 100) 3.1 Provide a description of the data (type, interval, etc.) 3.2 Calculate and provide a graph of the real value added tax for the period 1990 to 2018. Discuss the trends you observe in VAT collection, before and after 2008. (3) 3.3 Test the real value added tax and inflation variables for stationarity. Provide your results in the table below (please add rows where necessary): 'L' indicates the logarithmic function 'R' indicates that real values are used. Variable LRVAT INF Model Trend Intercept Intercept None Trend Intercept Intercept None and and Lags ADF test statistic 3.4 Test for possible cointegration between variables: (i) T. TUT Statistically significant at the: 10% level (*), 5% level (**), 1% level (***) You can assume that all other variables are non-stationary, integrated of order (1). Estimate the following long run cointegration equation. Copy and paste your EViews results window in your answer sheet. (2) LRVAT+ = a + BLRHCET +TLRM3t + res (ii) Evaluate the potential long-run equation. Do the estimated coefficients correspond to your a priori expectations in terms of sign? Explain. (iii) Generate the residual series for your long run equation. (Name your residual series as follows: res underscore the first three letters of your name, e.g. res_fan) Demonstrate, how you can use the residual series to test if cointegration exists between the variables in the long run model. (3) N 3.5 Construct a short run (Error Correction) component for your model (i) Estimate the following short run cointegration equation. Copy and paste your EViews results window in your answer sheet. (2) D(LRVAT):= a + BD(LRHCE)t + WD(LRHYD)t + $D(LAB)+2+ INF+2+ µres_###-1 (ii) Evaluate the ECM statistically. Also, comment on the number of lags included, and whether this makes sense in terms of your a priori expectations. (4) (iii) Perform diagnostic checks on the ECM. Test only for the potential problems as indicated below. In each instance, provide the name and a brief description of the test you perform. Also, clearly indicate how you draw your conclusions based on the results. (6) A. Normality B. Serial correlation C. Heteroscedasticity 3.6 Complete the model Create a model statement in EViews to combine your long-run and ECM. Provide your model statement (3 marks), and a copy of the graph depicting the actual and modelled values (2 marks), in the space provided. (5) [Total = 60 marks] In this question you must estimate a time series model for value added tax (VAT) collections, for South Africa. You are provided with the following data: Variable names and description: : Value added tax revenue, nominal (R millions) Final consumption expenditure by households, nominal (R millions) Disposable income of households, nominal (R millions) Money supply, nominal (R millions) VAT HCE : HYD : : M3 LAB : : INF CPI Nominal labor costs in the non-agricultural sectors (Index, 2010 = 100) Inflation (percentage, quarter on previous quarter at annual rate) : Consumer price index (Index, 2015 = 100) 3.1 Provide a description of the data (type, interval, etc.) 3.2 Calculate and provide a graph of the real value added tax for the period 1990 to 2018. Discuss the trends you observe in VAT collection, before and after 2008. (3) 3.3 Test the real value added tax and inflation variables for stationarity. Provide your results in the table below (please add rows where necessary): 'L' indicates the logarithmic function 'R' indicates that real values are used. Variable LRVAT INF Model Trend Intercept Intercept None Trend Intercept Intercept None and and Lags ADF test statistic 3.4 Test for possible cointegration between variables: (i) T. TUT Statistically significant at the: 10% level (*), 5% level (**), 1% level (***) You can assume that all other variables are non-stationary, integrated of order (1). Estimate the following long run cointegration equation. Copy and paste your EViews results window in your answer sheet. (2) LRVAT+ = a + BLRHCET +TLRM3t + res (ii) Evaluate the potential long-run equation. Do the estimated coefficients correspond to your a priori expectations in terms of sign? Explain. (iii) Generate the residual series for your long run equation. (Name your residual series as follows: res underscore the first three letters of your name, e.g. res_fan) Demonstrate, how you can use the residual series to test if cointegration exists between the variables in the long run model. (3) N 3.5 Construct a short run (Error Correction) component for your model (i) Estimate the following short run cointegration equation. Copy and paste your EViews results window in your answer sheet. (2) D(LRVAT):= a + BD(LRHCE)t + WD(LRHYD)t + $D(LAB)+2+ INF+2+ µres_###-1 (ii) Evaluate the ECM statistically. Also, comment on the number of lags included, and whether this makes sense in terms of your a priori expectations. (4) (iii) Perform diagnostic checks on the ECM. Test only for the potential problems as indicated below. In each instance, provide the name and a brief description of the test you perform. Also, clearly indicate how you draw your conclusions based on the results. (6) A. Normality B. Serial correlation C. Heteroscedasticity 3.6 Complete the model Create a model statement in EViews to combine your long-run and ECM. Provide your model statement (3 marks), and a copy of the graph depicting the actual and modelled values (2 marks), in the space provided. (5) [Total = 60 marks]
Expert Answer:
Answer rating: 100% (QA)
31 Description of the data The data provided is quarterly data for the period 1990 to 2018 The variables are all in real terms meaning that they have been adjusted for inflation 32 Graph of real value ... View the full answer
Related Book For
Accounting Principles
ISBN: 978-1119048473
7th Canadian Edition Volume 2
Authors: Jerry J. Weygandt, Donald E. Kieso, Paul D. Kimmel, Barbara Trenholm, Valerie Warren, Lori Novak
Posted Date:
Students also viewed these accounting questions
-
You are provided with the following transactions that took place during a recent fiscal year. (a) Recorded depreciation expense on the plant assets.(b) Incurred a loss on disposal of plant assets.(c)...
-
You are provided with the following transactions that took place during a recent fiscal year. (a) Recorded depreciation expense on the plant assets.(b) Incurred a loss on disposal of plant assets.(c)...
-
You are provided with the following transactions that took place during a recent fiscal year. InstructionsComplete the table indicating whether each item (1) Should be reported as an operating (O)...
-
paraphrase the following two passages using narrative in-text citations: 1.Those who teach ethics don't need to look far for lessons. Every day there's fresh scandal: Google is in hot water for how...
-
Prescott Companys predetermined overhead rate is 200% of direct labor. Information on the companys production activities during September 2013 follows. a. Purchased raw materials on credit, $...
-
Wires B and C are attached to a support at the left-hand end and to a pin-supported rigid bar at the right-hand end (see figure). Each wire has cross-sectional area A = 0.03 in.2 and modulus of...
-
What is the difference between augmented intelligence and autonomous intelligence?
-
The president of Mission Inc. has been concerned about the growth in costs over the last several years. The president asked the controller to perform an activity analysis to gain a better insight...
-
The Sailfish County authorized issuance of $10,000,000, 4 percent regular serial bonds in 20X0 for the construction of a new library. The bonds mature in equal amounts beginning January 1, 20X1, for...
-
Comprehensive Problem Bug-Off Exterminators December 31, 2019 Unadjusted Bug-Off Exterminators provides pest control services and sells extermination products manufactured by other companies....
-
One of the products that Company W makes is snack foods. The research and development department of Company W has developed a new formula for one type of snack food that is cheaper to make than the...
-
Solve for w. -38 5w-3 Simplify your answer as much as possible. W = 0
-
y = 36x + 25 b) Find the maxima and minima of 173-20
-
You are the chief risk officer (CRO) of an agricultural corporation. You expect to sell 100M bushels of corn in September. You are concerned about changing prices. You are considering three...
-
Forex bid and offer quotes by JOE BANK: NOK/ZAR BID:0.5606 & Offer:0.5672 (ZAR is the base currency) EUR/USD BID:0.9103 & OFFER:0.9168 (USD is the base currency) NOK/JPY BID: 0.0685 & OFFER:0.0725...
-
Find the surface area of the part of the paraboloid z = 2x+2y2 that lies under the plane z=16.
-
Where are customer requirements listed in the House of Quality?
-
Catherine (aged 42) and Johnson (aged 45) have been married for 12 years. Johnson is a project manager of an event company at a monthly salary of $55,000 with an additional one-month salary of...
-
On January 2, 2017, Hadley Inc., which reports under IFRS, purchased shares of Letourneau Corp. for $10 a share. Hadley intends to hold these shares as a long-term investment. During 2017, Letourneau...
-
Selected comparative statement data for Bluesky Company are presented below. All balance sheet data are as at December 31. Calculate for 2017 the following: (a) Asset turnover, (b) Return on assets,...
-
Pro Com Ltd. issues 8,000, $5 cumulative preferred shares at $66 each and 15,000 common shares at $30 each at the beginning of 2015. Each preferred share is convertible into two common shares. During...
-
State whether the following are true or false. If false, explain why. (a) Drawings are an expense recorded in the partners trading, profit and loss and appropriation account (i.e., a separate section...
-
Distinguish between a private limited company and a public limited company. Is there any difference between the users of the accounts of each type of company?
-
J. Waite and P. Watchers trial balance as at 30 November 2012 is set out below. 1. Closing inventory is 15,000. 2. Salaries are 18,000 for Waite and 16,000 for Watcher. 3. There is 300 owing for...
Study smarter with the SolutionInn App