

In your initial post, address the following items. Be sure to answer the questions about both...
Fantastic news! We've Found the answer you've been seeking!
Question:
Transcribed Image Text:
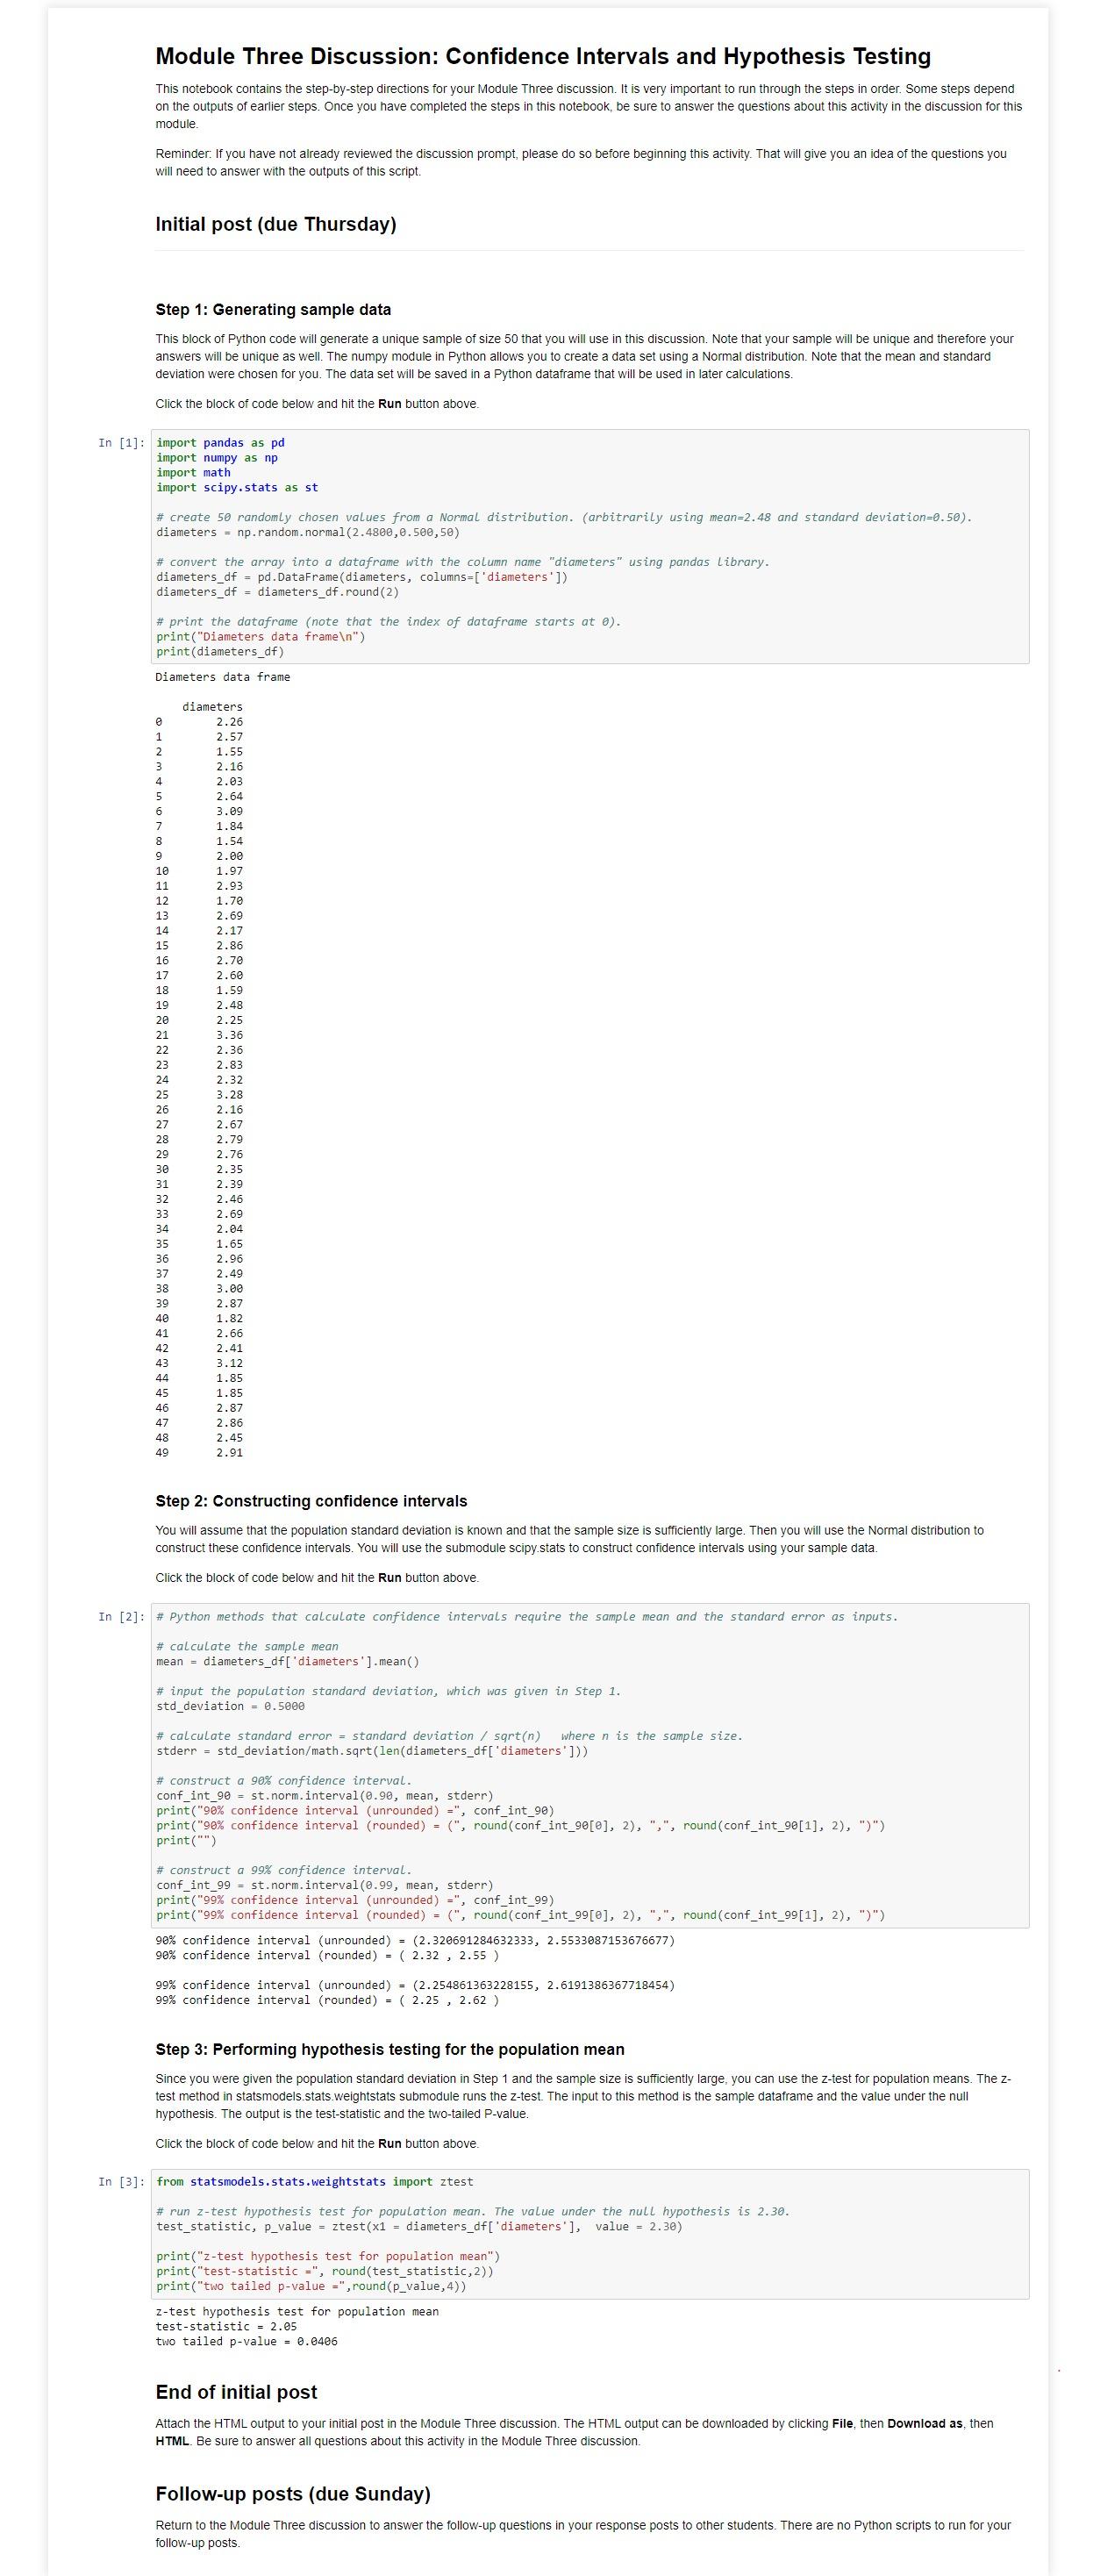
In your initial post, address the following items. Be sure to answer the questions about both confidence intervals and hypothesis testing. 1. In the Python script, you calculated the sample data to construct a 90% and 99% confidence interval for the average diameter of ball bearings produced from this manufacturing process. These confidence intervals were created using the Normal distribution based on the assumption that the population standard deviation is known and the sample size is sufficiently large. Report these confidence intervals rounded to two decimal places. See Step 2 in the Python script. 2. Interpret both confidence intervals. Make sure to be detailed and precise in your interpretation. It has been claimed from previous studies that the average diameter of ball bearings from this manufacturing process is 2.30 cm. Based on the sample of 50 that you collected, is there evidence to suggest that the average diameter is greater than 2.30 cm? Perform a hypothesis test for the population mean at alpha = 0.01. In your initial post, address the following items: 1. Define the null and alternative hypothesis for this test in mathematical terms and in words. 2. Report the level of significance. 3. Include the test statistic and the P-value. See Step 3 in the Python script. (Note that Python methods return two tailed P- values. You must report the correct P-value based on the alternative hypothesis.) 4. Provide your conclusion and interpretation of the results. Should the null hypothesis be rejected? Why or why not? Module Three Discussion: Confidence Intervals and Hypothesis Testing This notebook contains the step-by-step directions for your Module Three discussion. It is very important to run through the steps in order. Some steps depend on the outputs of earlier steps. Once you have completed the steps in this notebook, be sure to answer the questions about this activity in the discussion for this module. Reminder: If you have not already reviewed the discussion prompt, please do so before beginning this activity. That will give you an idea of the questions you will need to answer with the outputs of this script. Initial post (due Thursday) Step 1: Generating sample data This block of Python code will generate a unique sample of size 50 that you will use in this discussion. Note that your sample will be unique and therefore your answers will be unique as well. The numpy module in Python allows you to create a data set using a Normal distribution. Note that the mean and standard deviation were chosen for you. The data set will be saved in a Python dataframe that will be used in later calculations. Click the block of code below and hit the Run button above. In [1] import pandas as pd import numpy as np import math import scipy.stats as st # create 50 randomly chosen values from a Normal distribution. (arbitrarily using mean-2.48 and standard deviation=0.50). diameters = np.random.normal(2.4800,0.500,50) # convert the array into a dataframe with the column name "diameters" using pandas Library. diameters df = pd.DataFrame (diameters, columns=['diameters']) diameters df = diameters_df.round(2) # print the dataframe (note that the index of dataframe starts at 0). print("Diameters data frame ") print(diameters_df) Diameters data frame diameters 2.26 1 2.57 2 1.55 3 2.16 4 2.03. 5 2.64 6 3.09 7 1.84 8 1.54 9 2.00 10 1.97 2.93 1.70 13 2.69 2.17 15 2.86 40 42 9222222222222mmmmmmm 4 4 4 4 4 4 16 2.70 17 2.60 18 1.59 19 2.48 20 2.25 21 3.36 2.36 23 2.83 24 2.32 25 3.28 26 2.16 27 2.67 28 2.79 2.76 30 2.35 31 2.39 32 2.46 2.69 34 2.04 35 1.65 36 2.96 37 2.49 38 3.00 39 2.87 1.82 41 2.66 2.41 43 3.12 44 45 1.85 1.85 2.87 2.86 2.45 2.91 Step 2: Constructing confidence intervals You will assume that the population standard deviation is known and that the sample size is sufficiently large. Then you will use the Normal distribution to construct these confidence intervals. You will use the submodule scipy.stats to construct confidence intervals using your sample data. Click the block of code below and hit the Run button above. In [2] # Python methods that calculate confidence intervals require the sample mean and the standard error as inputs. # calculate the sample mean mean diameters_df[ 'diameters'].mean() # input the population standard deviation, which was given in Step 1. std_deviation = 0.5000 # calculate standard error = standard deviation/sqrt(n) where n is the sample size. stderr = std_deviation/math.sqrt(len(diameters_df[ 'diameters'])) # construct a 90% confidence interval. conf_int_90 = st. norm.interval (0.90, mean, stderr) print("90% confidence interval (unrounded) =", conf_int_90) print("90% confidence interval (rounded) = (", round (conf_int_90[0], 2), ",", round (conf_int_90[1], 2), ")") print("") # construct a 99% confidence interval. conf_int_99 st.norm.interval (0.99, mean, stderr) print("99% confidence interval (unrounded) =", conf_int_99) print("99% confidence interval (rounded) = (", round (conf_int_99[0], 2), ",", round (conf_int_99[1], 2), ")") 90% confidence interval (unrounded) = (2.320691284632333, 2.5533087153676677) 90% confidence interval (rounded) = ( 2.32, 2.55) 99% confidence interval (unrounded) = (2.254861363228155, 2.6191386367718454) 99% confidence interval (rounded) = ( 2.25, 2.62) Step 3: Performing hypothesis testing for the population mean Since you were given the population standard deviation in Step 1 and the sample size is sufficiently large, you can use the z-test for population means. The z- test method in statsmodels.stats.weightstats submodule runs the z-test. The input to this method is the sample dataframe and the value under the null hypothesis. The output is the test-statistic and the two-tailed P-value. Click the block of code below and hit the Run button above. In [3]: from statsmodels.stats.weightstats import ztest # run z-test hypothesis test for population mean. The value under the null hypothesis is 2.30. test_statistic, p_value = ztest (x1 = diameters_df[ 'diameters'], value = 2.30) print("z-test hypothesis test for population mean") print("test-statistic =", round (test_statistic, 2)) print("two tailed p-value =",round (p_value, 4)) z-test hypothesis test for population mean. test-statistic = 2.05 two tailed p-value = 0.0406 End of initial post Attach the HTML output to your initial post in the Module Three discussion. The HTML output can be downloaded by clicking File, then Download as, then HTML. Be sure to answer all questions about this activity in the Module Three discussion. Follow-up posts (due Sunday) Return to the Module Three discussion to answer the follow-up questions in your response posts to other students. There are no Python scripts to run for your follow-up posts. In your initial post, address the following items. Be sure to answer the questions about both confidence intervals and hypothesis testing. 1. In the Python script, you calculated the sample data to construct a 90% and 99% confidence interval for the average diameter of ball bearings produced from this manufacturing process. These confidence intervals were created using the Normal distribution based on the assumption that the population standard deviation is known and the sample size is sufficiently large. Report these confidence intervals rounded to two decimal places. See Step 2 in the Python script. 2. Interpret both confidence intervals. Make sure to be detailed and precise in your interpretation. It has been claimed from previous studies that the average diameter of ball bearings from this manufacturing process is 2.30 cm. Based on the sample of 50 that you collected, is there evidence to suggest that the average diameter is greater than 2.30 cm? Perform a hypothesis test for the population mean at alpha = 0.01. In your initial post, address the following items: 1. Define the null and alternative hypothesis for this test in mathematical terms and in words. 2. Report the level of significance. 3. Include the test statistic and the P-value. See Step 3 in the Python script. (Note that Python methods return two tailed P- values. You must report the correct P-value based on the alternative hypothesis.) 4. Provide your conclusion and interpretation of the results. Should the null hypothesis be rejected? Why or why not? Module Three Discussion: Confidence Intervals and Hypothesis Testing This notebook contains the step-by-step directions for your Module Three discussion. It is very important to run through the steps in order. Some steps depend on the outputs of earlier steps. Once you have completed the steps in this notebook, be sure to answer the questions about this activity in the discussion for this module. Reminder: If you have not already reviewed the discussion prompt, please do so before beginning this activity. That will give you an idea of the questions you will need to answer with the outputs of this script. Initial post (due Thursday) Step 1: Generating sample data This block of Python code will generate a unique sample of size 50 that you will use in this discussion. Note that your sample will be unique and therefore your answers will be unique as well. The numpy module in Python allows you to create a data set using a Normal distribution. Note that the mean and standard deviation were chosen for you. The data set will be saved in a Python dataframe that will be used in later calculations. Click the block of code below and hit the Run button above. In [1] import pandas as pd import numpy as np import math import scipy.stats as st # create 50 randomly chosen values from a Normal distribution. (arbitrarily using mean-2.48 and standard deviation=0.50). diameters = np.random.normal(2.4800,0.500,50) # convert the array into a dataframe with the column name "diameters" using pandas Library. diameters df = pd.DataFrame (diameters, columns=['diameters']) diameters df = diameters_df.round(2) # print the dataframe (note that the index of dataframe starts at 0). print("Diameters data frame ") print(diameters_df) Diameters data frame diameters 2.26 1 2.57 2 1.55 3 2.16 4 2.03. 5 2.64 6 3.09 7 1.84 8 1.54 9 2.00 10 1.97 2.93 1.70 13 2.69 2.17 15 2.86 40 42 9222222222222mmmmmmm 4 4 4 4 4 4 16 2.70 17 2.60 18 1.59 19 2.48 20 2.25 21 3.36 2.36 23 2.83 24 2.32 25 3.28 26 2.16 27 2.67 28 2.79 2.76 30 2.35 31 2.39 32 2.46 2.69 34 2.04 35 1.65 36 2.96 37 2.49 38 3.00 39 2.87 1.82 41 2.66 2.41 43 3.12 44 45 1.85 1.85 2.87 2.86 2.45 2.91 Step 2: Constructing confidence intervals You will assume that the population standard deviation is known and that the sample size is sufficiently large. Then you will use the Normal distribution to construct these confidence intervals. You will use the submodule scipy.stats to construct confidence intervals using your sample data. Click the block of code below and hit the Run button above. In [2] # Python methods that calculate confidence intervals require the sample mean and the standard error as inputs. # calculate the sample mean mean diameters_df[ 'diameters'].mean() # input the population standard deviation, which was given in Step 1. std_deviation = 0.5000 # calculate standard error = standard deviation/sqrt(n) where n is the sample size. stderr = std_deviation/math.sqrt(len(diameters_df[ 'diameters'])) # construct a 90% confidence interval. conf_int_90 = st. norm.interval (0.90, mean, stderr) print("90% confidence interval (unrounded) =", conf_int_90) print("90% confidence interval (rounded) = (", round (conf_int_90[0], 2), ",", round (conf_int_90[1], 2), ")") print("") # construct a 99% confidence interval. conf_int_99 st.norm.interval (0.99, mean, stderr) print("99% confidence interval (unrounded) =", conf_int_99) print("99% confidence interval (rounded) = (", round (conf_int_99[0], 2), ",", round (conf_int_99[1], 2), ")") 90% confidence interval (unrounded) = (2.320691284632333, 2.5533087153676677) 90% confidence interval (rounded) = ( 2.32, 2.55) 99% confidence interval (unrounded) = (2.254861363228155, 2.6191386367718454) 99% confidence interval (rounded) = ( 2.25, 2.62) Step 3: Performing hypothesis testing for the population mean Since you were given the population standard deviation in Step 1 and the sample size is sufficiently large, you can use the z-test for population means. The z- test method in statsmodels.stats.weightstats submodule runs the z-test. The input to this method is the sample dataframe and the value under the null hypothesis. The output is the test-statistic and the two-tailed P-value. Click the block of code below and hit the Run button above. In [3]: from statsmodels.stats.weightstats import ztest # run z-test hypothesis test for population mean. The value under the null hypothesis is 2.30. test_statistic, p_value = ztest (x1 = diameters_df[ 'diameters'], value = 2.30) print("z-test hypothesis test for population mean") print("test-statistic =", round (test_statistic, 2)) print("two tailed p-value =",round (p_value, 4)) z-test hypothesis test for population mean. test-statistic = 2.05 two tailed p-value = 0.0406 End of initial post Attach the HTML output to your initial post in the Module Three discussion. The HTML output can be downloaded by clicking File, then Download as, then HTML. Be sure to answer all questions about this activity in the Module Three discussion. Follow-up posts (due Sunday) Return to the Module Three discussion to answer the follow-up questions in your response posts to other students. There are no Python scripts to run for your follow-up posts.
Expert Answer:

Related Book For 

Statistics For The Behavioral Sciences
ISBN: 9781111830991
9th Edition
Authors: Frederick J Gravetter, Larry B. Wallnau
Posted Date:
Students also viewed these operating system questions
-
It has been claimed from previous studies that the average diameter of ball bearings from this manufacturing process is 2.30 cm. Based on the sample of 50 that you collected, is there evidence to...
-
Maggie, Bihun, and Mee decided to go into the landscaping business. The three orally declared that they would be partners in PPL Landscapers, sharing profits and losses equally. Maggie, Bihun, Mee...
-
Sayers Co. sold merchandise on account to a customer for $80,000 terms 2/10, n/30. The cost of the goods sold was $58,000. Journalize Sayers' entries to record (A) The sale, (B) The receipt of...
-
The 100-lb block is stationary at time t = 0, and then it is subjected to the force P shown. Note that the force is zero for all times beyond t = 15 sec. Determine the velocity v of the block at time...
-
Petitioner Salman was indicted for federal securities-fraud crimes for trading on inside information he received from a friend and relative-by-marriage, Michael Kara, who, in turn, had received the...
-
(Bond Issue) Donald Lennon is the president, founder, and majority owner of Wichita Medical Corporation, an emerging medical technology products company. Wichita is in dire need of additional capital...
-
Hi guys, write 300 words for each of the discussion questions. 1) Compare and contrast benefits and challenges that exist between centralized database management systems and distributed database...
-
a. How much will you have in 5 years if you invest $25,000 for a 5-year period at an annual interest rate of: a. 25%? b. 12%? c. 7%? d. 0%? b. You have been told you will receive $75,000 at some time...
-
When PERT is used and probabilities are found, one of the assumptions that is made is that a. all activities are on the critical path. b. activity times are independent. c. all activities have the...
-
What are the advantages and disadvantages of a point-to-point route system?
-
Total expected cost is obtained by taking the expected service costs minus the expected waiting costs. a. True b. False
-
Which one can be a Monte Carlo simulation variable? a. lead time for inventory orders to arrive b. times between machine breakdowns c. number of absent employees at a certain time d. all of the above
-
The latest finish time for an activity is found during the backward pass through the network. The latest finish time is equal to a. the largest LF of the activities for which it is an immediate...
-
The amino acids in the original partial sequence (N-term-...V-G-E-N-E-S...-C-term) have little to no impact on protein structure and function, with the exception of serine. Phosphorylation of the...
-
Would you use the adjacency matrix structure or the adjacency list structure in each of the following cases? Justify your choice. a. The graph has 10,000 vertices and 20,000 edges, and it is...
-
Research has demonstrated that people tend to be attracted to others who are similar to themselves. One study demonstrated that individuals are disproportionately more likely to marry those with...
-
For the following population of N = 6 scores: a. Sketch a histogram showing the population distribution. b. Locate the value of the population mean in your sketch, and make an estimate of the...
-
A researcher is investigating the effectiveness of acupuncture treatment for chronic back pain. A sample of n = 20 participants is obtained from a pain clinic. Each individual rates the current level...
-
How might planning in a not-for-profit organization such as the World Wildlife Fund differ from planning in a for-profit organization such as Airbnb?
-
Provide examples of the sources of data a residential solar panel company might gather when engaging in environmental scanning. Exhibit 8-6 may be helpful when answering this question.
-
What advantages and disadvantages does Johnson Controls OpenBlue platform have over companies looking to develop solutions on their own?

Study smarter with the SolutionInn App