

Walmart's Ratio Analysis Required: Comment on the Walmart's 3-year trends in the following liquidity, solvency, and...
Fantastic news! We've Found the answer you've been seeking!
Question:
Transcribed Image Text:
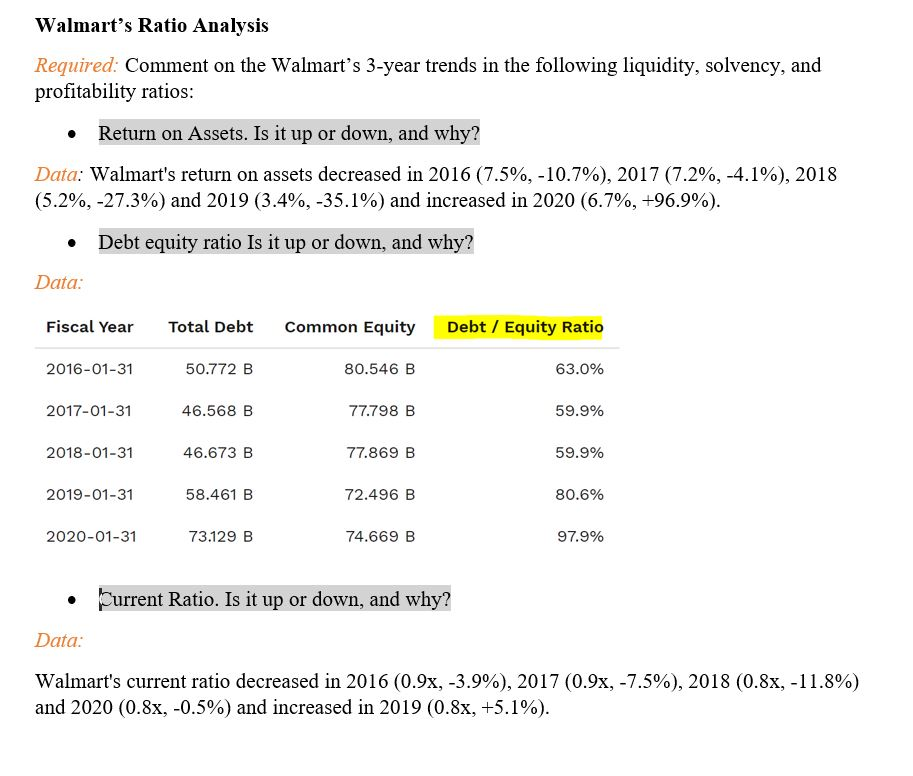
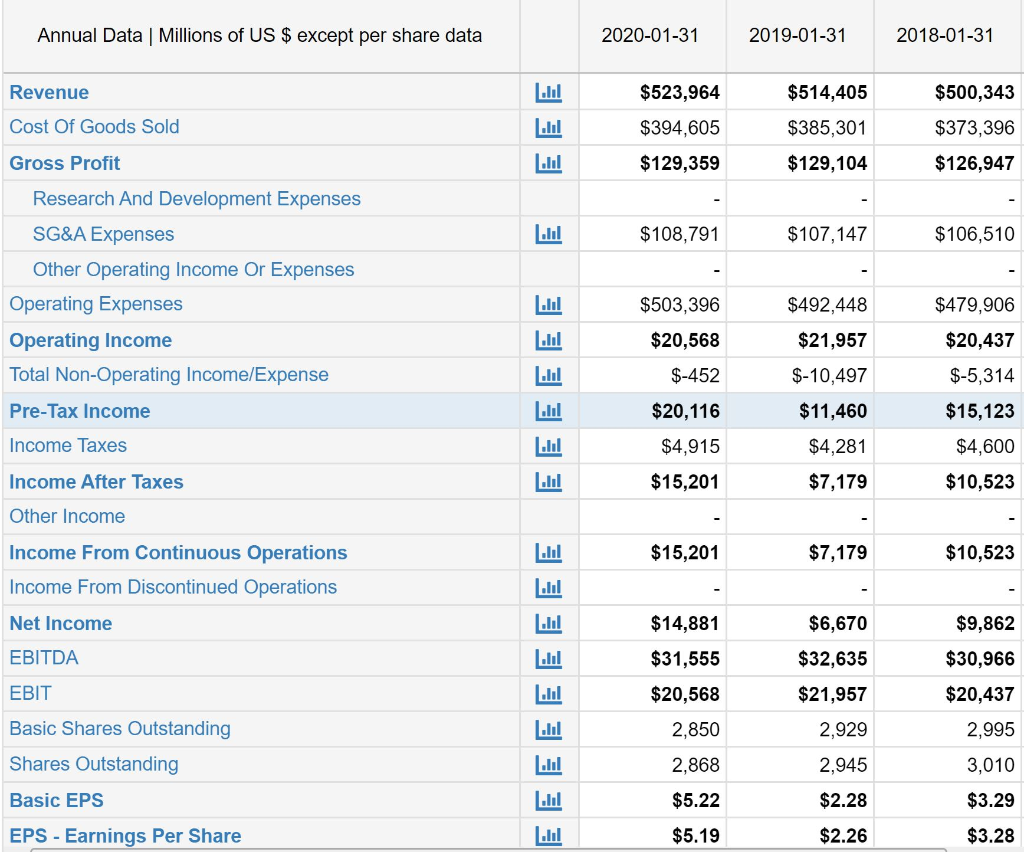
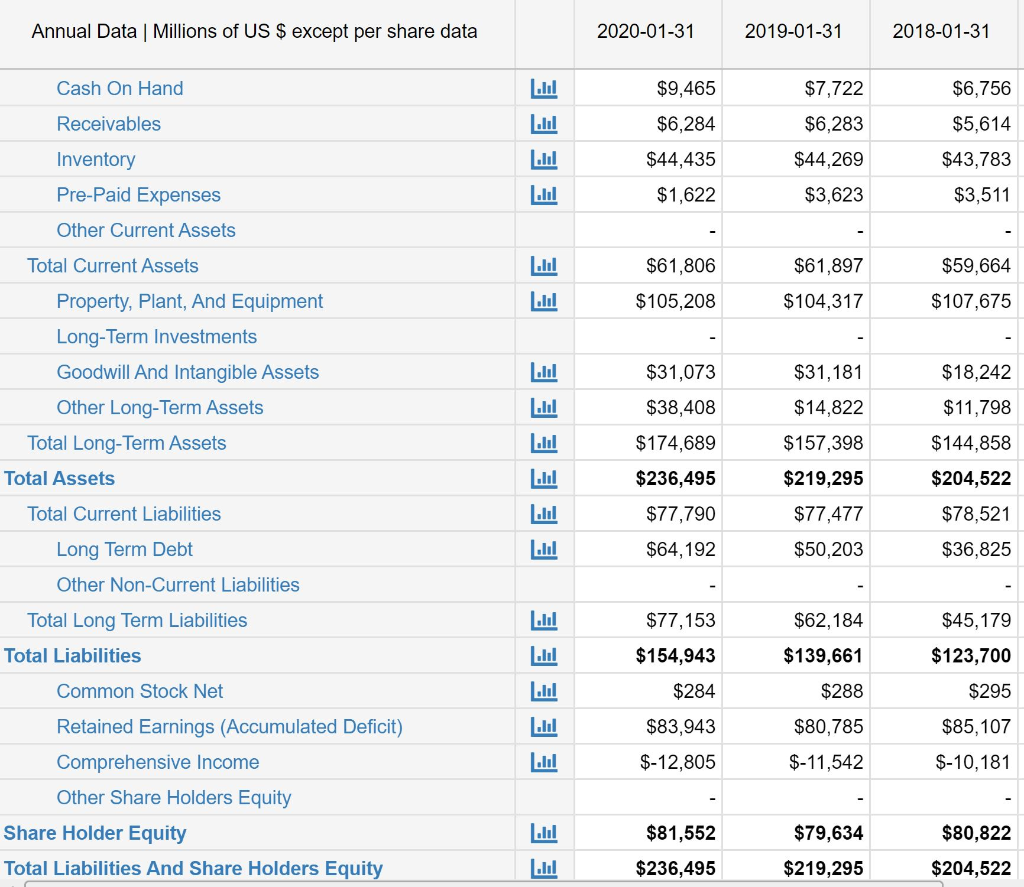
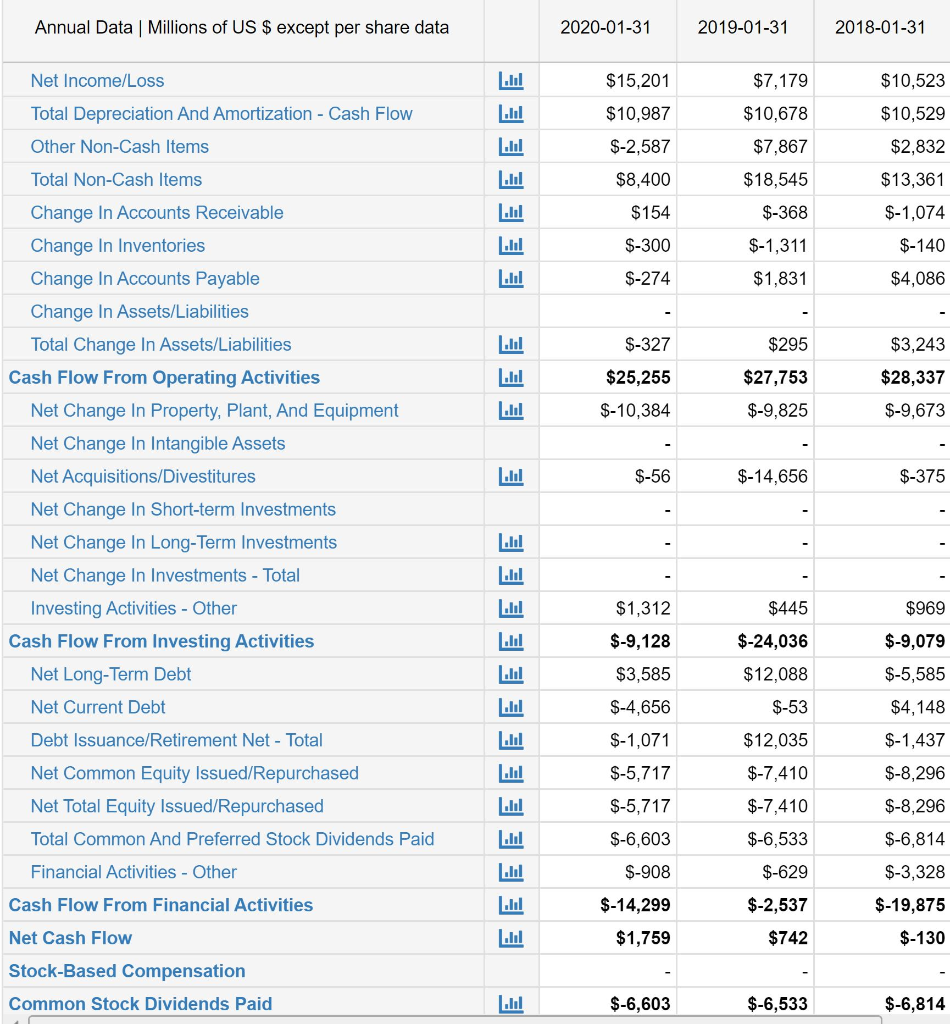
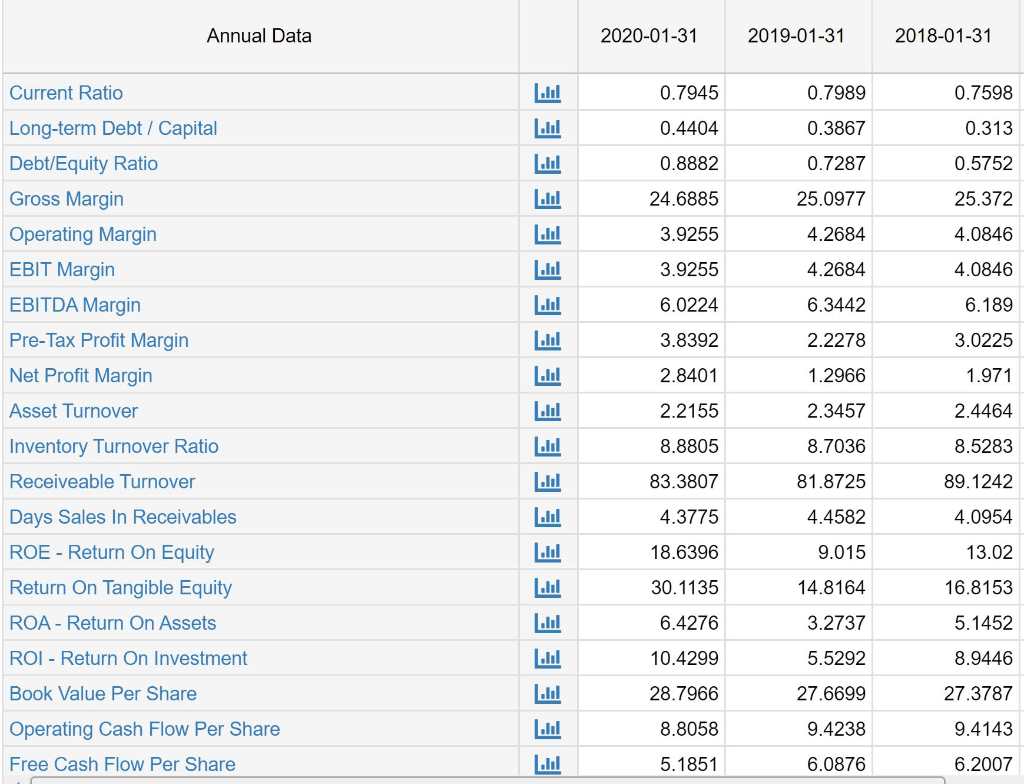
Walmart's Ratio Analysis Required: Comment on the Walmart's 3-year trends in the following liquidity, solvency, and profitability ratios: • Return on Assets. Is it up or down, and why? Data: Walmart's return on assets decreased in 2016 (7.5%, -10.7%), 2017 (7.2%, -4.1%), 2018 (5.2%, -27.3%) and 2019 (3.4%, -35.1%) and increased in 2020 (6.7%, +96.9%). Debt equity ratio Is it up or down, and why? Data: Fiscal Year 2016-01-31 2017-01-31 2018-01-31 2019-01-31 2020-01-31 Total Debt 50.772 B 46.568 B 46.673 B 58.461 B 73.129 B Common Equity 80.546 B 77.798 B 77.869 B 72.496 B 74.669 B Debt / Equity Ratio • Current Ratio. Is it up or down, and why? Data: 63.0% 59.9% 59.9% 80.6% 97.9% Walmart's current ratio decreased in 2016 (0.9x, -3.9%), 2017 (0.9x, -7.5%), 2018 (0.8x, -11.8%) and 2020 (0.8x, -0.5%) and increased in 2019 (0.8x, +5.1%). Annual Data | Millions of US $ except per share data Revenue Cost Of Goods Sold Gross Profit Research And Development Expenses SG&A Expenses Other Operating Income Or Expenses Operating Expenses Operating Income Total Non-Operating Income/Expense Pre-Tax Income Income Taxes Income After Taxes Other Income Income From Continuous Operations Income From Discontinued Operations Net Income EBITDA EBIT Basic Shares Outstanding Shares Outstanding Basic EPS EPS - Earnings Per Share EEE 3 Lul EEEEEE EEE ..... EEEEE 2020-01-31 $523,964 $394,605 $129,359 $108,791 $503,396 $20,568 $-452 $20,116 $4,915 $15,201 $15,201 $14,881 $31,555 $20,568 2,850 2,868 $5.22 $5.19 2019-01-31 $514,405 $385,301 $129,104 $107,147 $492,448 $21,957 $-10,497 $11,460 $4,281 $7,179 $7,179 $6,670 $32,635 $21,957 2,929 2,945 $2.28 $2.26 2018-01-31 $500,343 $373,396 $126,947 $106,510 $479,906 $20,437 $-5,314 $15,123 $4,600 $10,523 - $10,523 $9,862 $30,966 $20,437 2,995 3,010 $3.29 $3.28 Annual Data | Millions of US $ except per share data Cash On Hand Receivables Inventory Pre-Paid Expenses Other Current Assets Total Current Assets Property, Plant, And Equipment Long-Term Investments Goodwill And Intangible Assets Other Long-Term Assets Total Long-Term Assets Total Assets Total Current Liabilities Long Term Debt Other Non-Current Liabilities Total Long Term Liabilities Total Liabilities Common Stock Net Retained Earnings (Accumulated Deficit) Comprehensive Income Other Share Holders Equity Share Holder Equity Total Liabilities And Share Holders Equity EEEE EE EEEEEE 3 3 3 3 3 EE 2020-01-31 $9,465 $6,284 $44,435 $1,622 $61,806 $105,208 $31,073 $38,408 $174,689 $236,495 $77,790 $64,192 $77,153 $154,943 $284 $83,943 $-12,805 $81,552 $236,495 2019-01-31 $7,722 $6,283 $44,269 $3,623 $61,897 $104,317 $31,181 $14,822 $157,398 $219,295 $77,477 $50,203 $62,184 $139,661 $288 $80,785 $-11,542 $79,634 $219,295 2018-01-31 $6,756 $5,614 $43,783 $3,511 $59,664 $107,675 $18,242 $11,798 $144,858 $204,522 $78,521 $36,825 $45,179 $123,700 $295 $85,107 $-10,181 $80,822 $204,522 Annual Data | Millions of US $ except per share data Net Income/Loss Total Depreciation And Amortization - Cash Flow Other Non-Cash Items Total Non-Cash Items Change In Accounts Receivable Change In Inventories Change In Accounts Payable Change In Assets/Liabilities Total Change In Assets/Liabilities Cash Flow From Operating Activities Net Change In Property, Plant, And Equipment Net Change In Intangible Assets Net Acquisitions/Divestitures Net Change In Short-term Investments Net Change In Long-Term Investments Net Change In Investments - Total Investing Activities - Other Cash Flow From Investing Activities Net Long-Term Debt Net Current Debt Debt Issuance/Retirement Net - Total Net Common Equity Issued/Repurchased Net Total Equity Issued/Repurchased Total Common And Preferred Stock Dividends Paid Financial Activities - Other Cash Flow From Financial Activities Net Cash Flow Stock-Based Compensation Common Stock Dividends Paid EEEEEEE EEE E الا EEEEE الا اسا L.M اسا الا ... اسا اسا E 2020-01-31 $15,201 $10,987 $-2,587 $8,400 $154 $-300 $-274 $-327 $25,255 $-10,384 $-56 $1,312 $-9,128 $3,585 $-4,656 $-1,071 $-5,717 $-5,717 $-6,603 $-908 $-14,299 $1,759 $-6,603 2019-01-31 $7,179 $10,678 $7,867 $18,545 $-368 $-1,311 $1,831 $295 $27,753 $-9,825 $-14,656 $445 $-24,036 $12,088 $-53 $12,035 $-7,410 $-7,410 $-6,533 $-629 $-2,537 $742 $-6,533 2018-01-31 $10,523 $10,529 $2,832 $13,361 $-1,074 $-140 $4,086 $3,243 $28,337 $-9,673 $-375 $969 $-9,079 $-5,585 $4,148 $-1,437 $-8,296 $-8,296 $-6,814 $-3,328 $-19,875 $-130 $-6,814 Annual Data Current Ratio Long-term Debt / Capital Debt/Equity Ratio Gross Margin Operating Margin EBIT Margin EBITDA Margin Pre-Tax Profit Margin Net Profit Margin Asset Turnover Inventory Turnover Ratio Receiveable Turnover Days Sales In Receivables ROE - Return On Equity Return On Tangible Equity ROA - Return On Assets ROI - Return On Investment Book Value Per Share Operating Cash Flow Per Share Free Cash Flow Per Share EEEEEE سا 1.bl ..... لسا لا Lul .... لا L.h .... ..... EEE 2020-01-31 0.7945 0.4404 0.8882 24.6885 3.9255 3.9255 6.0224 3.8392 2.8401 2.2155 8.8805 83.3807 4.3775 18.6396 30.1135 6.4276 10.4299 28.7966 8.8058 5.1851 2019-01-31 0.7989 0.3867 0.7287 25.0977 4.2684 4.2684 6.3442 2.2278 1.2966 2.3457 8.7036 81.8725 4.4582 9.015 14.8164 3.2737 5.5292 27.6699 9.4238 6.0876 2018-01-31 0.7598 0.313 0.5752 25.372 4.0846 4.0846 6.189 3.0225 1.971 2.4464 8.5283 89.1242 4.0954 13.02 16.8153 5.1452 8.9446 27.3787 9.4143 6.2007 Walmart's Ratio Analysis Required: Comment on the Walmart's 3-year trends in the following liquidity, solvency, and profitability ratios: • Return on Assets. Is it up or down, and why? Data: Walmart's return on assets decreased in 2016 (7.5%, -10.7%), 2017 (7.2%, -4.1%), 2018 (5.2%, -27.3%) and 2019 (3.4%, -35.1%) and increased in 2020 (6.7%, +96.9%). Debt equity ratio Is it up or down, and why? Data: Fiscal Year 2016-01-31 2017-01-31 2018-01-31 2019-01-31 2020-01-31 Total Debt 50.772 B 46.568 B 46.673 B 58.461 B 73.129 B Common Equity 80.546 B 77.798 B 77.869 B 72.496 B 74.669 B Debt / Equity Ratio • Current Ratio. Is it up or down, and why? Data: 63.0% 59.9% 59.9% 80.6% 97.9% Walmart's current ratio decreased in 2016 (0.9x, -3.9%), 2017 (0.9x, -7.5%), 2018 (0.8x, -11.8%) and 2020 (0.8x, -0.5%) and increased in 2019 (0.8x, +5.1%). Annual Data | Millions of US $ except per share data Revenue Cost Of Goods Sold Gross Profit Research And Development Expenses SG&A Expenses Other Operating Income Or Expenses Operating Expenses Operating Income Total Non-Operating Income/Expense Pre-Tax Income Income Taxes Income After Taxes Other Income Income From Continuous Operations Income From Discontinued Operations Net Income EBITDA EBIT Basic Shares Outstanding Shares Outstanding Basic EPS EPS - Earnings Per Share EEE 3 Lul EEEEEE EEE ..... EEEEE 2020-01-31 $523,964 $394,605 $129,359 $108,791 $503,396 $20,568 $-452 $20,116 $4,915 $15,201 $15,201 $14,881 $31,555 $20,568 2,850 2,868 $5.22 $5.19 2019-01-31 $514,405 $385,301 $129,104 $107,147 $492,448 $21,957 $-10,497 $11,460 $4,281 $7,179 $7,179 $6,670 $32,635 $21,957 2,929 2,945 $2.28 $2.26 2018-01-31 $500,343 $373,396 $126,947 $106,510 $479,906 $20,437 $-5,314 $15,123 $4,600 $10,523 - $10,523 $9,862 $30,966 $20,437 2,995 3,010 $3.29 $3.28 Annual Data | Millions of US $ except per share data Cash On Hand Receivables Inventory Pre-Paid Expenses Other Current Assets Total Current Assets Property, Plant, And Equipment Long-Term Investments Goodwill And Intangible Assets Other Long-Term Assets Total Long-Term Assets Total Assets Total Current Liabilities Long Term Debt Other Non-Current Liabilities Total Long Term Liabilities Total Liabilities Common Stock Net Retained Earnings (Accumulated Deficit) Comprehensive Income Other Share Holders Equity Share Holder Equity Total Liabilities And Share Holders Equity EEEE EE EEEEEE 3 3 3 3 3 EE 2020-01-31 $9,465 $6,284 $44,435 $1,622 $61,806 $105,208 $31,073 $38,408 $174,689 $236,495 $77,790 $64,192 $77,153 $154,943 $284 $83,943 $-12,805 $81,552 $236,495 2019-01-31 $7,722 $6,283 $44,269 $3,623 $61,897 $104,317 $31,181 $14,822 $157,398 $219,295 $77,477 $50,203 $62,184 $139,661 $288 $80,785 $-11,542 $79,634 $219,295 2018-01-31 $6,756 $5,614 $43,783 $3,511 $59,664 $107,675 $18,242 $11,798 $144,858 $204,522 $78,521 $36,825 $45,179 $123,700 $295 $85,107 $-10,181 $80,822 $204,522 Annual Data | Millions of US $ except per share data Net Income/Loss Total Depreciation And Amortization - Cash Flow Other Non-Cash Items Total Non-Cash Items Change In Accounts Receivable Change In Inventories Change In Accounts Payable Change In Assets/Liabilities Total Change In Assets/Liabilities Cash Flow From Operating Activities Net Change In Property, Plant, And Equipment Net Change In Intangible Assets Net Acquisitions/Divestitures Net Change In Short-term Investments Net Change In Long-Term Investments Net Change In Investments - Total Investing Activities - Other Cash Flow From Investing Activities Net Long-Term Debt Net Current Debt Debt Issuance/Retirement Net - Total Net Common Equity Issued/Repurchased Net Total Equity Issued/Repurchased Total Common And Preferred Stock Dividends Paid Financial Activities - Other Cash Flow From Financial Activities Net Cash Flow Stock-Based Compensation Common Stock Dividends Paid EEEEEEE EEE E الا EEEEE الا اسا L.M اسا الا ... اسا اسا E 2020-01-31 $15,201 $10,987 $-2,587 $8,400 $154 $-300 $-274 $-327 $25,255 $-10,384 $-56 $1,312 $-9,128 $3,585 $-4,656 $-1,071 $-5,717 $-5,717 $-6,603 $-908 $-14,299 $1,759 $-6,603 2019-01-31 $7,179 $10,678 $7,867 $18,545 $-368 $-1,311 $1,831 $295 $27,753 $-9,825 $-14,656 $445 $-24,036 $12,088 $-53 $12,035 $-7,410 $-7,410 $-6,533 $-629 $-2,537 $742 $-6,533 2018-01-31 $10,523 $10,529 $2,832 $13,361 $-1,074 $-140 $4,086 $3,243 $28,337 $-9,673 $-375 $969 $-9,079 $-5,585 $4,148 $-1,437 $-8,296 $-8,296 $-6,814 $-3,328 $-19,875 $-130 $-6,814 Annual Data Current Ratio Long-term Debt / Capital Debt/Equity Ratio Gross Margin Operating Margin EBIT Margin EBITDA Margin Pre-Tax Profit Margin Net Profit Margin Asset Turnover Inventory Turnover Ratio Receiveable Turnover Days Sales In Receivables ROE - Return On Equity Return On Tangible Equity ROA - Return On Assets ROI - Return On Investment Book Value Per Share Operating Cash Flow Per Share Free Cash Flow Per Share EEEEEE سا 1.bl ..... لسا لا Lul .... لا L.h .... ..... EEE 2020-01-31 0.7945 0.4404 0.8882 24.6885 3.9255 3.9255 6.0224 3.8392 2.8401 2.2155 8.8805 83.3807 4.3775 18.6396 30.1135 6.4276 10.4299 28.7966 8.8058 5.1851 2019-01-31 0.7989 0.3867 0.7287 25.0977 4.2684 4.2684 6.3442 2.2278 1.2966 2.3457 8.7036 81.8725 4.4582 9.015 14.8164 3.2737 5.5292 27.6699 9.4238 6.0876 2018-01-31 0.7598 0.313 0.5752 25.372 4.0846 4.0846 6.189 3.0225 1.971 2.4464 8.5283 89.1242 4.0954 13.02 16.8153 5.1452 8.9446 27.3787 9.4143 6.2007
Expert Answer:
Answer rating: 100% (QA)
ANSWER Walmarts return on assets ROA decreased from 75 in 2016 to 34 in 2019 before increasing to 67 ... View the full answer

Related Book For 

Corporate Financial Accounting
ISBN: 978-1337272124
15th edition
Authors: Carl S. Warren, James M. Reeve, Jonathan Duchac
Posted Date:
Students also viewed these accounting questions
-
P Company has provided the following data: Sales Price per unit: RM50 Variable Cost per unit: RM30 Fixed Cost: RM135,000 Expected Sales: 20,000 units a) What is the breakeven point in sales dollars?...
-
The Culleye Corporation reported the following solvency ratios: 2017 2016 Debt to total assets.....56.0%....................52.8% Interest coverage........5.1 times............3.3 times (a) Identify...
-
CHAPTER EXERCISES: [110] 1. Let A 0 1 1 and B= 2 5 1 0 1 [1 2 3] 3. Find A and B- by [108] (a) Solving the matrix equation AX = I for X (b) Adjoining the matrices with I or using Gauss-Jordan...
-
In September 2020 Kevin sells a drawing for 2,000. He bought the drawing in February 2014 for 50,000 when it was thought (incorrectly) to be by a famous artist. Compute the allowable loss.
-
Gate City Cycles had trouble collecting its account receivable from Sue Ann Noel. On June 19, 2014, Gate City finally wrote off Noels $ 700 account receivable. On December 31, Noel sent a $ 700 check...
-
Although Janet Lambert has run a small business for many years, she has never kept adequate accounting records. However, a need to obtain a bank loan for the expansion of the business has...
-
P(54 < x < 64) Write the binomial probability in words. Then, use a continuity correction to convert the binomial probability to a normal distribution probability.
-
As the HR manager for a multinational corporation, you want to identify HR competencies that are critical for global companies. Visit the website for the World Federation of People Management...
-
A 3-phase, 220 kV, 50 Hz transmission line consists of 15 cm radius conductor spaced 2 meters apart in equilateral triangular formation. If the temperature is 40C and atmospheric pressure is 76 cm,...
-
During a baseball practice session, the cutoff man A executes a throw to the third baseman B. If the initial speed of the baseball is v 0 = 130 ft/sec, what launch angle is best if the ball is to...
-
Bill is a single taxpayer, age 27. In 2019, his salary is $29,000 and he has interest income of $1,500. In addition, he has deductions for adjusted gross income of $2,200 and he has $6,500 of...
-
I want us to explore different tools we may use and why. Using either a past project or one you have researched for this course, identify at least one quantitative tool and one qualitative...
-
On January 1, Year 8, T-Best Corporation issued $10 million face value, 10-year bonds. The bonds carry a stated interest rate of 6 percent per year, payable semiannually on June 30 and December 31....
-
Examine groups of people and their ways of interacting. Different types of groups have different purposes and can vary widely in their influence on our lives. Respond to the following in a minimum of...
-
An object's temperature is at 100 C ( = 393 Kelvin). What is the peak wavelength in micrometer (m) of photons being emitted by this object? (note: make sure you use the temperature in the correct...
-
Do you believe the "rational model" is predominant in criminal justice organizations? How does efficiency factor into the organization?
-
Please explain how and why the MATLAB Onramp training course located on the MathWorks website can be by far the best resource to get you up to snuff on the basics of MATLAB?
-
Find the market equilibrium point for the following demand and supply functions. Demand: 2p = - q + 56 Supply: 3p - q = 34
-
The following accounts and their balances were selected from the unadjusted trial balance of Point Loma Group Inc., a freight forwarder, at October 31, the end of the current fiscal year: Common...
-
Ralph Lauren Corporation (RL) sells apparel through company-owned retail stores. Financial information for Ralph Lauren follows (in thousands): Assume the apparel industry average return on total...
-
Sears Editing Company is a small editorial services company owned and operated by Deloris Sears. On January 31, 20Y1, the end of the current year, Sears Editing Companys accounting clerk prepared the...
-
Victoria has prepared the following list of statements about corporations. 1. A corporation is an entity separate and distinct from its owners. 2. As a legal entity, a corporation has most of the...
-
Indicate whether the following items would appear on the income statement (IS), statement of financial position (SFP), or retained earnings statement (RES). a. Dividends. b. Cash. c. Salaries and...
-
On May 10, Chen Co. issues 2,000 6 par value ordinary shares for cash at 13 per share. Journalize the issuance of the shares.

Study smarter with the SolutionInn App