

6 First, solve the problems without using Minitab, and then develop also Minitab solution (where appropriate)....
Fantastic news! We've Found the answer you've been seeking!
Question:
Transcribed Image Text:
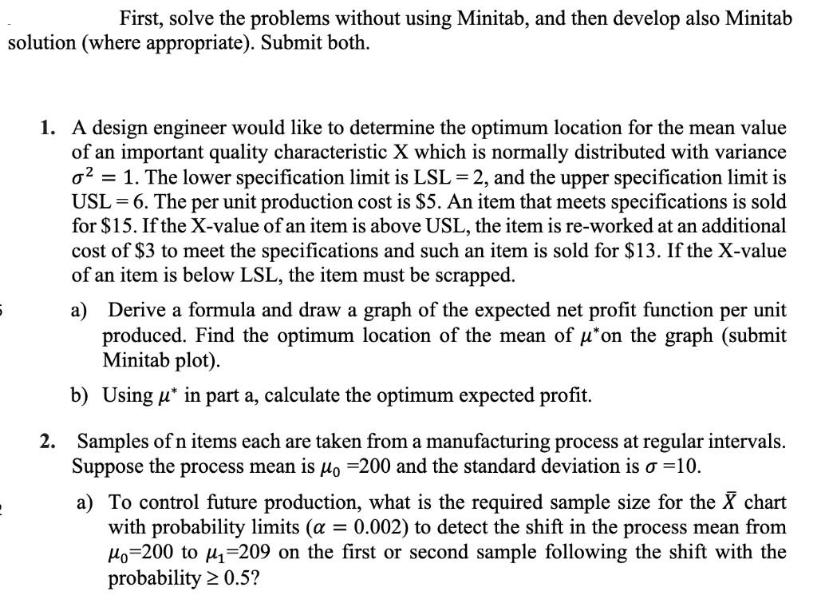
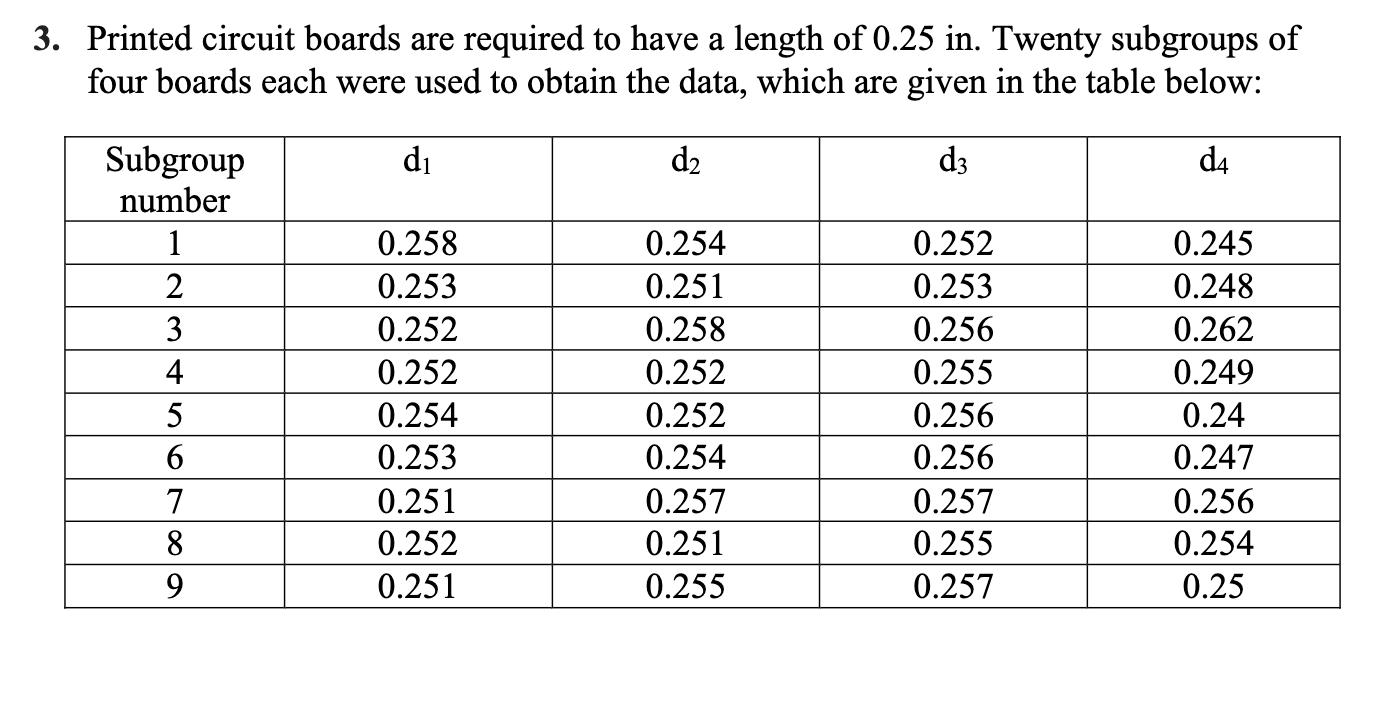
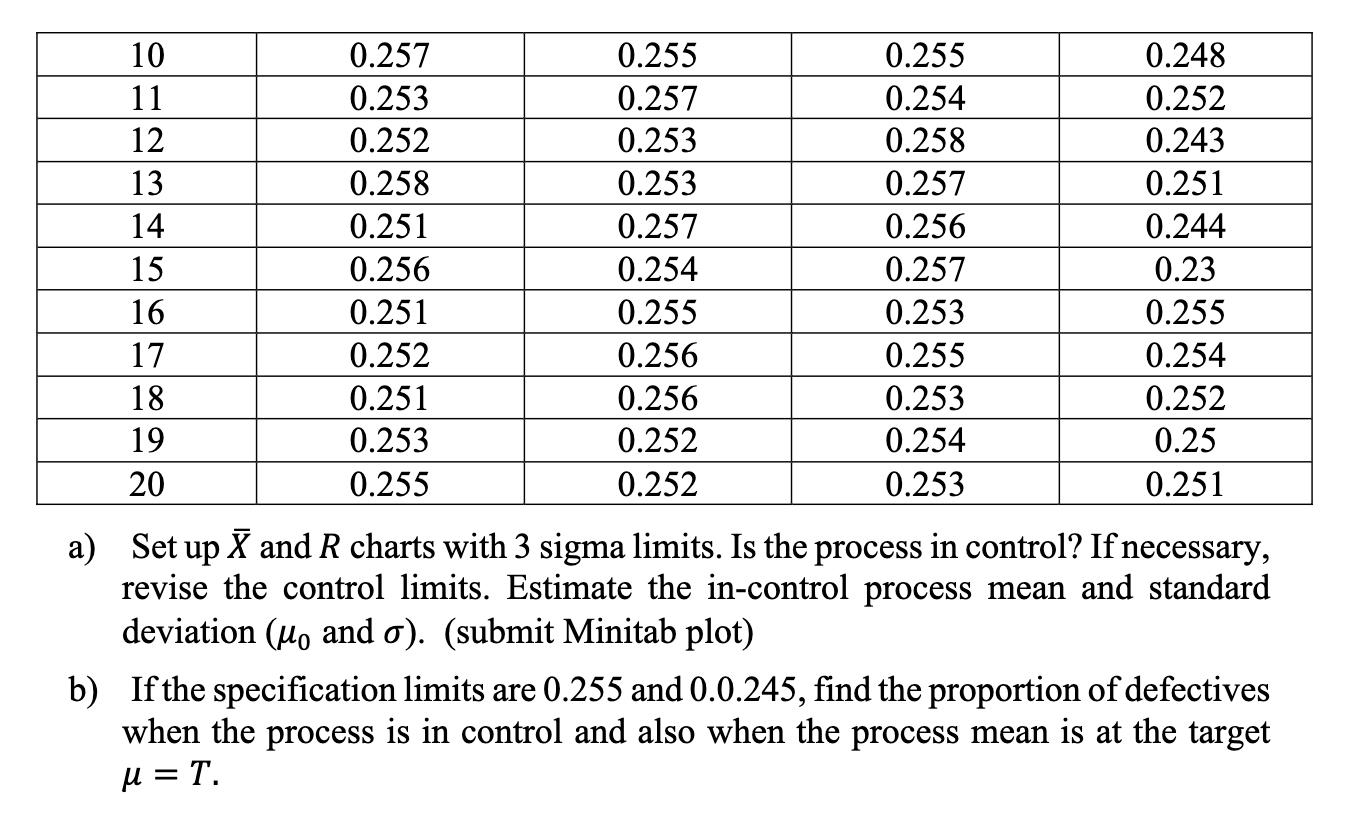
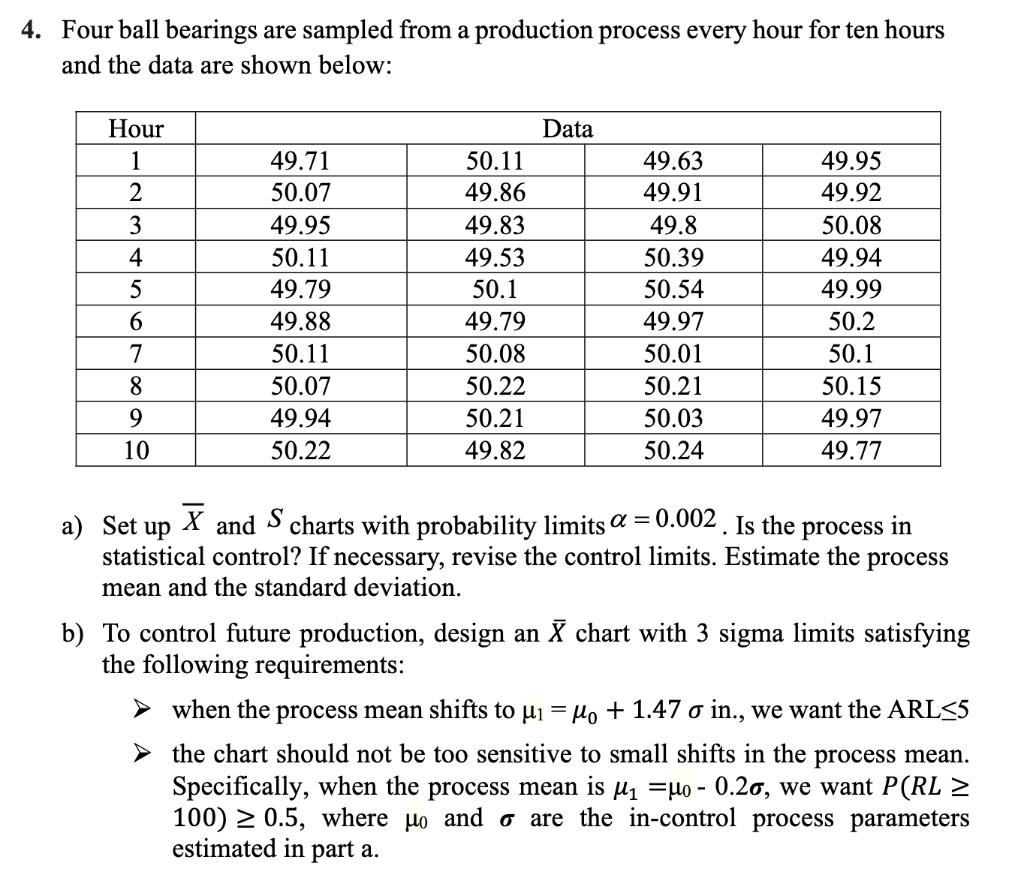
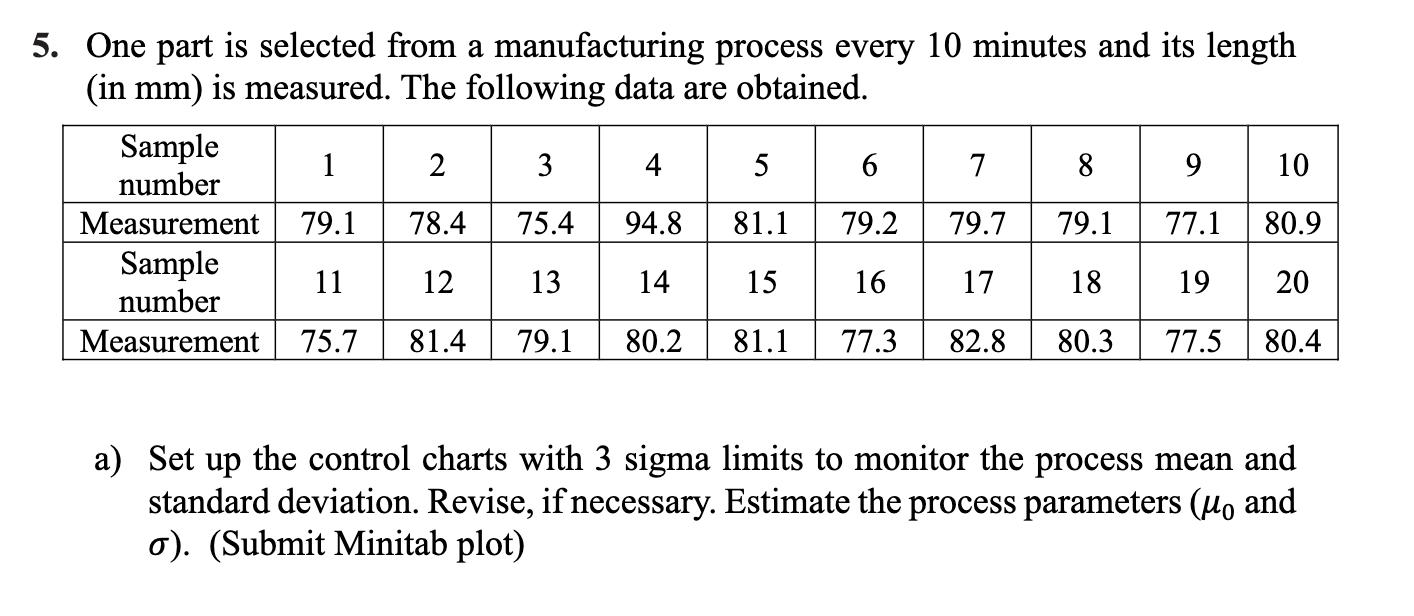
6 First, solve the problems without using Minitab, and then develop also Minitab solution (where appropriate). Submit both. 1. A design engineer would like to determine the optimum location for the mean value of an important quality characteristic X which is normally distributed with variance o² = 1. The lower specification limit is LSL = 2, and the upper specification limit is USL = 6. The per unit production cost is $5. An item that meets specifications is sold for $15. If the X-value of an item is above USL, the item is re-worked at an additional cost of $3 to meet the specifications and such an item is sold for $13. If the X-value of an item is below LSL, the item must be scrapped. a) Derive a formula and draw a graph of the expected net profit function per unit produced. Find the optimum location of the mean of u*on the graph (submit Minitab plot). b) Using u in part a, calculate the optimum expected profit. 2. Samples of n items each are taken from a manufacturing process at regular intervals. Suppose the process mean is μo =200 and the standard deviation is o =10. a) To control future production, what is the required sample size for the X chart with probability limits (a = 0.002) to detect the shift in the process mean from Mo-200 to μ₁-209 on the first or second sample following the shift with the probability ≥ 0.5? 3. Printed circuit boards are required to have a length of 0.25 in. Twenty subgroups of four boards each were used to obtain the data, which are given in the table below: d₁ d₂ d3 d4 Subgroup number 1 2 3 4 5 6 7 8 9 0.258 0.253 0.252 0.252 0.254 0.253 0.251 0.252 0.251 0.254 0.251 0.258 0.252 0.252 0.254 0.257 0.251 0.255 0.252 0.253 0.256 0.255 0.256 0.256 0.257 0.255 0.257 0.245 0.248 0.262 0.249 0.24 0.247 0.256 0.254 0.25 10 11 12 13 14 15 16 17 18 19 20 0.257 0.253 0.252 0.258 0.251 0.256 0.251 0.252 0.251 0.253 0.255 0.255 0.257 0.253 0.253 0.257 0.254 0.255 0.256 0.256 0.252 0.252 0.255 0.254 0.258 0.257 0.256 0.257 0.253 0.255 0.253 0.254 0.253 0.248 0.252 0.243 0.251 0.244 0.23 0.255 0.254 0.252 0.25 0.251 a) Set up X and R charts with 3 sigma limits. Is the process in control? If necessary, revise the control limits. Estimate the in-control process mean and standard deviation (μo and σ). (submit Minitab plot) b) If the specification limits are 0.255 and 0.0.245, find the proportion of defectives when the process is in control and also when the process mean is at the target μ = T. 4. Four ball bearings are sampled from a production process every hour for ten hours and the data are shown below: Hour 1 2 3 4 5 6 7 8 9 10 49.71 50.07 49.95 50.11 49.79 49.88 50.11 50.07 49.94 50.22 50.11 49.86 49.83 49.53 50.1 49.79 50.08 50.22 50.21 49.82 Data 49.63 49.91 49.8 50.39 50.54 49.97 50.01 50.21 50.03 50.24 49.95 49.92 50.08 49.94 49.99 50.2 50.1 50.15 49.97 49.77 a) Set up X and S charts with probability limits a = 0.002. Is the process in statistical control? If necessary, revise the control limits. Estimate the process mean and the standard deviation. b) To control future production, design an X chart with 3 sigma limits satisfying the following requirements: when the process mean shifts to μ₁ = μo + 1.47 o in., we want the ARL<5 the chart should not be too sensitive to small shifts in the process mean. Specifically, when the process mean is μ₁ =μo - 0.20, we want P(RL ≥ 100)≥ 0.5, where μo and are the in-control process parameters estimated in part a. 5. One part is selected from a manufacturing process every 10 minutes and its length (in mm) is measured. The following data are obtained. Sample number 1 2 6 7 10 Measurement 79.1 78.4 75.4 94.8 81.1 79.2 79.7 79.1 77.1 80.9 16 17 18 20 Sample 11 12 13 14 15 19 number Measurement 75.7 81.4 79.1 80.2 81.1 77.3 82.8 80.3 77.5 80.4 a) Set up the control charts with 3 sigma limits to monitor the process mean and standard deviation. Revise, if necessary. Estimate the process parameters (μo and o). (Submit Minitab plot) 6 First, solve the problems without using Minitab, and then develop also Minitab solution (where appropriate). Submit both. 1. A design engineer would like to determine the optimum location for the mean value of an important quality characteristic X which is normally distributed with variance o² = 1. The lower specification limit is LSL = 2, and the upper specification limit is USL = 6. The per unit production cost is $5. An item that meets specifications is sold for $15. If the X-value of an item is above USL, the item is re-worked at an additional cost of $3 to meet the specifications and such an item is sold for $13. If the X-value of an item is below LSL, the item must be scrapped. a) Derive a formula and draw a graph of the expected net profit function per unit produced. Find the optimum location of the mean of u*on the graph (submit Minitab plot). b) Using u in part a, calculate the optimum expected profit. 2. Samples of n items each are taken from a manufacturing process at regular intervals. Suppose the process mean is μo =200 and the standard deviation is o =10. a) To control future production, what is the required sample size for the X chart with probability limits (a = 0.002) to detect the shift in the process mean from Mo-200 to μ₁-209 on the first or second sample following the shift with the probability ≥ 0.5? 3. Printed circuit boards are required to have a length of 0.25 in. Twenty subgroups of four boards each were used to obtain the data, which are given in the table below: d₁ d₂ d3 d4 Subgroup number 1 2 3 4 5 6 7 8 9 0.258 0.253 0.252 0.252 0.254 0.253 0.251 0.252 0.251 0.254 0.251 0.258 0.252 0.252 0.254 0.257 0.251 0.255 0.252 0.253 0.256 0.255 0.256 0.256 0.257 0.255 0.257 0.245 0.248 0.262 0.249 0.24 0.247 0.256 0.254 0.25 10 11 12 13 14 15 16 17 18 19 20 0.257 0.253 0.252 0.258 0.251 0.256 0.251 0.252 0.251 0.253 0.255 0.255 0.257 0.253 0.253 0.257 0.254 0.255 0.256 0.256 0.252 0.252 0.255 0.254 0.258 0.257 0.256 0.257 0.253 0.255 0.253 0.254 0.253 0.248 0.252 0.243 0.251 0.244 0.23 0.255 0.254 0.252 0.25 0.251 a) Set up X and R charts with 3 sigma limits. Is the process in control? If necessary, revise the control limits. Estimate the in-control process mean and standard deviation (μo and σ). (submit Minitab plot) b) If the specification limits are 0.255 and 0.0.245, find the proportion of defectives when the process is in control and also when the process mean is at the target μ = T. 4. Four ball bearings are sampled from a production process every hour for ten hours and the data are shown below: Hour 1 2 3 4 5 6 7 8 9 10 49.71 50.07 49.95 50.11 49.79 49.88 50.11 50.07 49.94 50.22 50.11 49.86 49.83 49.53 50.1 49.79 50.08 50.22 50.21 49.82 Data 49.63 49.91 49.8 50.39 50.54 49.97 50.01 50.21 50.03 50.24 49.95 49.92 50.08 49.94 49.99 50.2 50.1 50.15 49.97 49.77 a) Set up X and S charts with probability limits a = 0.002. Is the process in statistical control? If necessary, revise the control limits. Estimate the process mean and the standard deviation. b) To control future production, design an X chart with 3 sigma limits satisfying the following requirements: when the process mean shifts to μ₁ = μo + 1.47 o in., we want the ARL<5 the chart should not be too sensitive to small shifts in the process mean. Specifically, when the process mean is μ₁ =μo - 0.20, we want P(RL ≥ 100)≥ 0.5, where μo and are the in-control process parameters estimated in part a. 5. One part is selected from a manufacturing process every 10 minutes and its length (in mm) is measured. The following data are obtained. Sample number 1 2 6 7 10 Measurement 79.1 78.4 75.4 94.8 81.1 79.2 79.7 79.1 77.1 80.9 16 17 18 20 Sample 11 12 13 14 15 19 number Measurement 75.7 81.4 79.1 80.2 81.1 77.3 82.8 80.3 77.5 80.4 a) Set up the control charts with 3 sigma limits to monitor the process mean and standard deviation. Revise, if necessary. Estimate the process parameters (μo and o). (Submit Minitab plot)
Expert Answer:

Related Book For 

Quantitative Methods for Business
ISBN: 978-0324651751
11th Edition
Authors: David Anderson, Dennis Sweeney, Thomas Williams, Jeffrey cam
Posted Date:
Students also viewed these accounting questions
-
The net profit of investment is normally distributed with a mean of $10,000 and a standard deviation of $5,000. The probability that the investors net profit will be between $12,000 and $15,000 is...
-
The Sea Wharf Restaurant would like to determine the best way to allocate a monthly advertising budget of $1000 between newspaper advertising and radio advertising. Management decided that at least...
-
A finance executive would like to determine if a relationship exists between the current earnings per share (EPS) of a bank and the following independent variables: Total assets ($ billions) ...
-
One of the most common reasons why projects undergo scope changes is: A. Poor work breakdown structure B. Poorly defined statement of work C. Lack of resources D. Lack of funding
-
A 2-tooth left-hand worm transmits ¾ hp at 600 rev/min to a 36-tooth gear having a transverse diametral pitch of 8 teeth/in. The worm has a normal pressure angle of 20¦, a pitch...
-
Identify five users of accounting information and explain how they use it.
-
Wendy Craven is the sole shareholder of a property management company near the campus of Pensacola Junior College. The business has cash of \($6,000\) and furniture that cost \($12,000\) and has a...
-
1. Income and Substitution Effects. Sabrina works for a workers cooperative that initially pays her a lump sum of $200 per week (as long as she works at least 15 hours per week) and a wage of $20 per...
-
1. What do you think is driving Howard Schultz's socially responsible initiatives? Why? 2. What socially responsible policies do you find most impressive? Why? 3. What do you think of Starbucks'...
-
In the investment world, commodities are typically pretty boring. From livestock to grains to steel and other metals, commodities have their ups and downs. But long term, the world will always need...
-
Simplify. 80 125 Be sure to write your answer in simplest form. X VB
-
The following cost data pertain to the operations of Montgomery Department Stores, Incorporated, for the month of July. Corporate legal office salaries Apparel Department cost of sales-Evendale Store...
-
Simplify. M 65 12u y 3 4 201 + 12x y
-
Explain why this macroeconomic issue is relevant to you. Support your choice with economic concepts you have learned, and be sure to cite your sources. Should the Tax Laws Be Reformed to Encourage...
-
Data for daily returns is provided below for Chinese Stocks. Calculate expected returns and standard deviation and recommend which counter you would invest in based on expected returns and secondly...
-
Concord, Inc. is considering purchasing equipment costing $23000 with a 6-year useful life. The equipment will provide cost savings of $5500 and will be depreciated straight-line over its useful life...
-
Explain what net neutrality is and why it is important to the late 2020s. What does it mean legally? What does it mean practically for the Internet?
-
$10,000 was borrowed at 3.5% on July 17. The borrower repaid $5000 on August 12, and $2000 on September 18. What final payment is required on November 12 to fully repay the loan?
-
Managers at Wagner Fabricating Company are reviewing the economic feasibility of manufacturing a part that it currently purchases from a supplier. Forecasted annual demand for the part is 3200 units....
-
Hudson Corporation is considering three options for managing its data processing operation: continuing with its own staff, hiring an outside vendor to do the managing (referred to as outsourcing), or...
-
The Lake Placid Town Council decided to build a new community center to be used for conventions, concerts, and other public events, but considerable controversy surrounds the appropriate size. Many...
-
Following are several tests of controls introduced in the chapter: Examine periodic reports by non-Purchasing Department personnel regarding purchase prices and practices. Observe Receiving...
-
Harold Brodkey plans to apply sequential sampling to the receiving controls used by the Ozyck Corporation, a December 31, 1999 year end manufacturer and supplier of home lighting fixtures. Based on a...
-
Few departments within a corporation, not-for-profit institution, or governmental entity can have quite as significant an influence on cost containment as Purchasing, since the purchasing function...

Study smarter with the SolutionInn App