

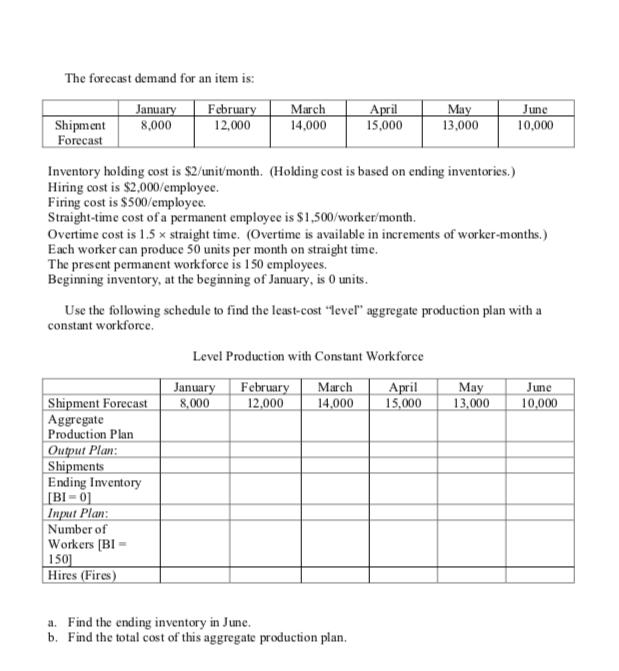
The forecast demand for an item is: January Shipment 8,000 Forecast February 12,000 Shipment Forecast Aggregate...
Fantastic news! We've Found the answer you've been seeking!
Question:
Expert Answer:
Current capacity 150x507500 Required capacity 1200050240 Month Jan Feb MAR Apr May June Forecast 800... View the full answer

Related Book For 

Posted Date:
