Inventory Specialists, Inc. provides inventory verification services for the grocery store industry. Each week they physically count
Question:
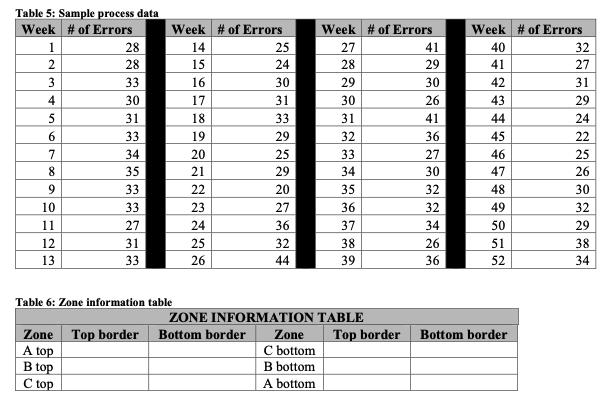
Inventory Specialists, Inc. provides inventory verification services for the grocery store industry. Each week they physically count the inventory of each of the products their customers carry and check the numbers against what the customer’s automated inventory tracking system indicates is being held in inventory. Table 5 below provides the number of products for which their was a discrepancy between the physical count and the amount provided by the inventory tracking system of Customer X over the last year. The company would like to determine whether Customer X’s automated inventory tracking process is in control or experiencing an excessive level of non-random variation as it pertains to the count discrepancies. Use the data provided in Table 5 to answer the following questions. Carry calculations out to at least 3 decimal places.
What is type of control chart(s) should be constructed based on the data provided (i.e., c, p, X-bar, and/or R)?
What is the central limit for this data?
What are the 3-sigma upper and lower control limits? Show your calculations.
Construct the control chart showing not only the control limits but also the zone lines for the Pattern
Test discussed in class. Label the zones on the chart and identify the value of the top and bottom borders of each zone by completing the Zone Information Table below (Table 6).
Note: The control chart may be created in Excel but a copy of it should be embedded as a picture in your test document. Make sure it is large enough to read all elements. (6)State whether the process appears to be in control. Justify your answer.
List all of the patterns associated with the Pattern Test discussed in class and identify if any Pattern Test
violations found. If any Pattern Test violations are found, identify which points fit the pattern.
Expert Answer: