

It is also required to use a MenuStrip control with the following menu items: - Output/Chart, to
No answer yet for this question.
Ask a Tutor
Question:
It is also required to use a MenuStrip control with the following menu items: - Output/Chart, to display the bar graph - Output/Table, to display all individual agents' data - Output/Results, to display the results of all required calculations for the agency - Exit, to terminate the program If you send the rest for the code let me know. I just need help now on how to make a chart and table and show the results.
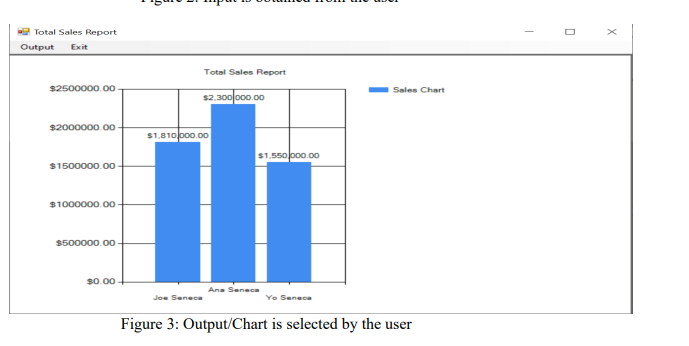
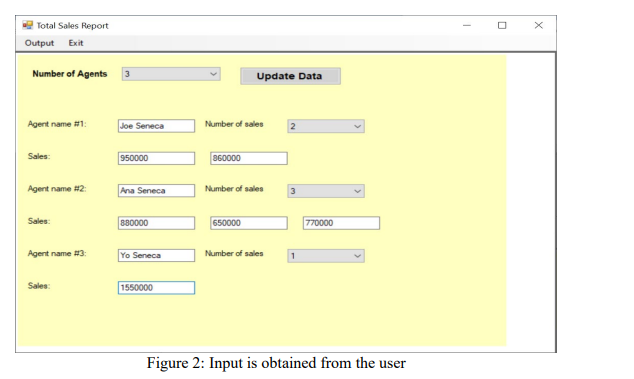
using the update data btn.
private void chartMenuItem_Click(object sender, EventArgs e)
{
// create the chart
Chart chart1 = new Chart();
// Set the chart type to column
chart1.Series.Add("Sales");
chart1.Series["Sales"].ChartType = SeriesChartType.Column;
// Add data points to the chart for the selected agents
if (dataGridView1 != null && dataGridView1.SelectedRows != null)
{
foreach (DataGridViewRow row in dataGridView1.SelectedRows)
{
string agentName = row.Cells[0].Value.ToString();
Agents agent = agents.FirstOrDefault(a => a.agentname == agentName);
if (agent != null && agent.agentname != null)
{
chart1.Series["Sales"].Points.AddXY(agent.agentname, agent.totalsales);
}
}
}
// Customize the chart as desired
chart1.ChartAreas.Add(new ChartArea());
chart1.ChartAreas[0].AxisX.Title = "Agents Names";
chart1.ChartAreas[0].AxisY.Title = "Sales Chart";
chart1.ChartAreas[0].AxisY.Interval = 50000000;
chart1.ChartAreas[0].AxisY.IntervalAutoMode = IntervalAutoMode.FixedCount;
chart1.Titles.Add("Sales Report Chart");
// Create a new form to display the chart
Form chartForm = new Form();
chartForm.ClientSize = new Size(600, 400);
// Attach the chart to the form
chart1.Parent = chartForm;
chart1.Dock = DockStyle.Fill;
// Show the form
chartForm.Show();
Expert Answer:

Related Book For 

Auditing a risk based approach to conducting a quality audit
ISBN: 978-1133939153
9th edition
Authors: Karla Johnstone, Audrey Gramling, Larry Rittenberg
Posted Date:
