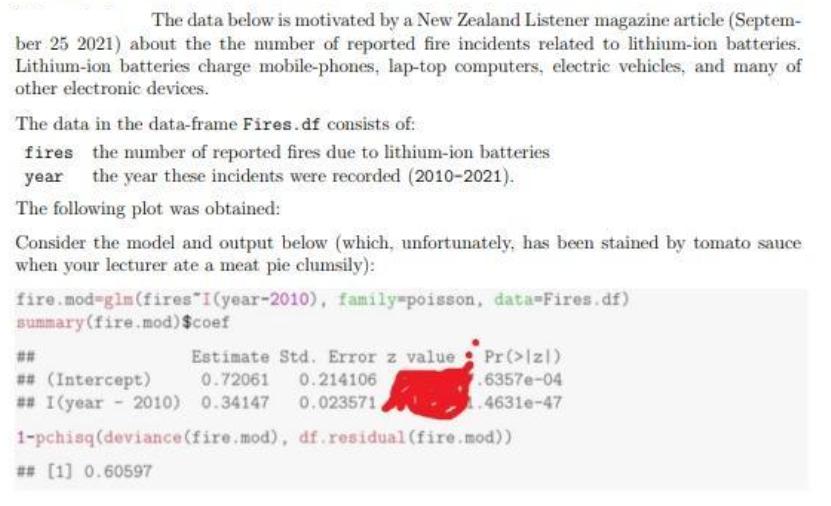
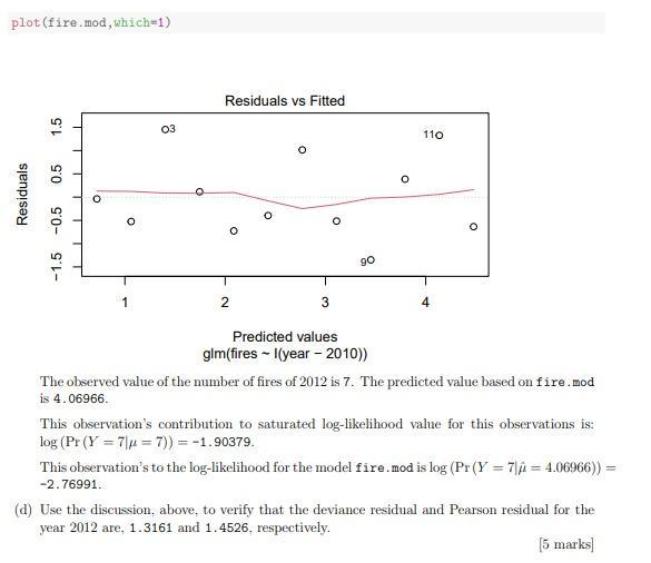
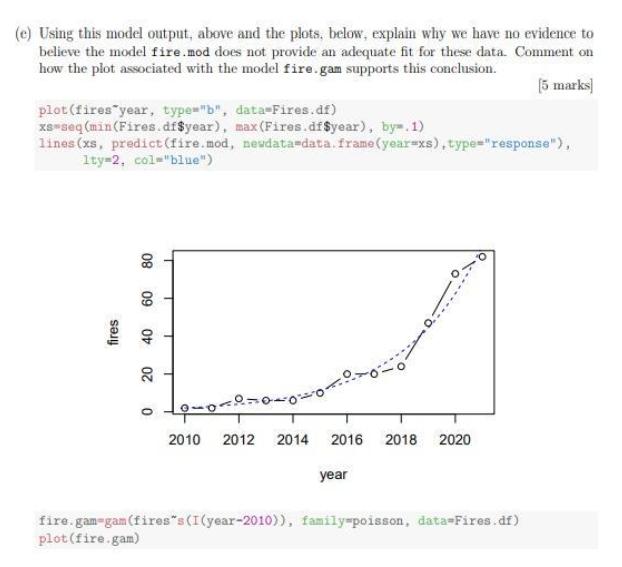
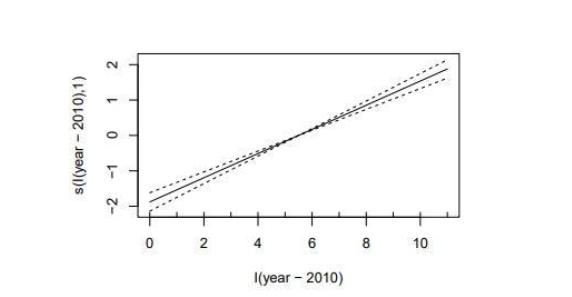
The data below is motivated by a New Zealand Listener magazine article (Septem- ber 25 2021)...
Fantastic news! We've Found the answer you've been seeking!
Question:
Transcribed Image Text:
The data below is motivated by a New Zealand Listener magazine article (Septem- ber 25 2021) about the the number of reported fire incidents related to lithium-ion batteries. Lithium-ion batteries charge mobile-phones, lap-top computers, electric vehicles, and many of other electronic devices. The data in the data-frame Fires.df consists of: fires the number of reported fires due to lithium-ion batteries the year these incidents were recorded (2010-2021). year The following plot was obtained: Consider the model and output below (which, unfortunately, has been stained by tomato sauce when your lecturer ate a meat pie clumsily): fire.mod gim (fires I(year-2010), family-poisson, data-Fires.df) summary(fire.mod) $coef Estimate Std. Error z value Pr (>Izl) 0.72061 0.214106 ## ## (Intercept) ## I(year 2010) 0.34147 0.023571, 1-pchisq (deviance (fire.mod), df.residual (fire.mod)) ## [1] 0.60597 7.6357e-04 1.46316-47 plot (fire.mod, which=1) Residuals 1.5 0.5 -0.5 -1.5 03 Residuals vs Fitted O 2 3 Predicted values glm(fires - I(year - 2010)) 110 O The observed value of the number of fires of 2012 is 7. The predicted value based on fire.mod is 4.06966. This observation's contribution to saturated log-likelihood value for this observations is: log (Pr (Y=7]μ = 7)) = -1.90379. This observation's to the log-likelihood for the model fire.mod is log (Pr (Y=7=4.06966)) = -2.76991. (d) Use the discussion, above, to verify that the deviance residual and Pearson residual for the year 2012 are. 1.3161 and 1.4526, respectively. [5 marks] (e) Using this model output, above and the plots, below, explain why we have no evidence to believe the model fire.mod does not provide an adequate fit for these data. Comment on how the plot associated with the model fire.gam supports this conclusion. [5 marks] plot (fires year, type="b", data-Fires.df) xs-seq (min (Fires.df$year), max (Fires.df$year), by-.1) lines (xs, predict (fire.mod, neudata-data.frame(year-xs), type="response"), 1ty=2, col="blue") 80 60 20 0 -0-0-0-0 O year a. 2010 2012 2014 2016 2018 2020 fire.gam-gam(fires s (I(year-2010)), family-poisson, data-Fires.df) plot (fire.gam) s(l(year-2010),1) 2 1 0 -2 -1 02 4 6 8 I(year - 2010) 10 The data below is motivated by a New Zealand Listener magazine article (Septem- ber 25 2021) about the the number of reported fire incidents related to lithium-ion batteries. Lithium-ion batteries charge mobile-phones, lap-top computers, electric vehicles, and many of other electronic devices. The data in the data-frame Fires.df consists of: fires the number of reported fires due to lithium-ion batteries the year these incidents were recorded (2010-2021). year The following plot was obtained: Consider the model and output below (which, unfortunately, has been stained by tomato sauce when your lecturer ate a meat pie clumsily): fire.mod gim (fires I(year-2010), family-poisson, data-Fires.df) summary(fire.mod) $coef Estimate Std. Error z value Pr (>Izl) 0.72061 0.214106 ## ## (Intercept) ## I(year 2010) 0.34147 0.023571, 1-pchisq (deviance (fire.mod), df.residual (fire.mod)) ## [1] 0.60597 7.6357e-04 1.46316-47 plot (fire.mod, which=1) Residuals 1.5 0.5 -0.5 -1.5 03 Residuals vs Fitted O 2 3 Predicted values glm(fires - I(year - 2010)) 110 O The observed value of the number of fires of 2012 is 7. The predicted value based on fire.mod is 4.06966. This observation's contribution to saturated log-likelihood value for this observations is: log (Pr (Y=7]μ = 7)) = -1.90379. This observation's to the log-likelihood for the model fire.mod is log (Pr (Y=7=4.06966)) = -2.76991. (d) Use the discussion, above, to verify that the deviance residual and Pearson residual for the year 2012 are. 1.3161 and 1.4526, respectively. [5 marks] (e) Using this model output, above and the plots, below, explain why we have no evidence to believe the model fire.mod does not provide an adequate fit for these data. Comment on how the plot associated with the model fire.gam supports this conclusion. [5 marks] plot (fires year, type="b", data-Fires.df) xs-seq (min (Fires.df$year), max (Fires.df$year), by-.1) lines (xs, predict (fire.mod, neudata-data.frame(year-xs), type="response"), 1ty=2, col="blue") 80 60 20 0 -0-0-0-0 O year a. 2010 2012 2014 2016 2018 2020 fire.gam-gam(fires s (I(year-2010)), family-poisson, data-Fires.df) plot (fire.gam) s(l(year-2010),1) 2 1 0 -2 -1 02 4 6 8 I(year - 2010) 10
Expert Answer:
Answer rating: 100% (QA)
Decrease in cash 2970000 1150000 1820000 New current ratio Current assets decrease in cash Current l... View the full answer
Related Book For
Posted Date:
Students also viewed these accounting questions
-
The owner of an ice cream parlor is concerned about consistency in the amount of ice cream his servers put in each cone. He would like the variance of all such cones to be no more than .25 square...
-
The owner of Gilleys Ice Cream Parlor has noticed that she sells more ice cream on hotter days during the summer, especially on days when the temperature is 85 or higher. To plan how much ice cream...
-
Jack and Gillian Grant, owners of Grants Ice Cream Shop Ltd., have recently expanded their business by moving into a second location in a nearby town. To open the second location, the company had to...
-
Jarvis Company produces a product that has a selling price of $20.00 and a variable cost of $15.00 per unit. The company's fixed costs are $50,000. What is the break-even point measured in sales...
-
What does validity mean? How does it differ from verification? What issues must an analyst consider in building realistic models?
-
A digital transmission channel distorts on average 1 out of 10000 bits during transmission. The bits are transmitted independently of each other. (1) Give the exact formula for the probability of the...
-
Which of the following distance measures is commonly applied to a frequency-document matrix and why? a. Jaccard distancebecause text is expressed as binary variables in a frequencydocument matrix. b....
-
Munson Co. uses a job order cost system. The following data summarize the operations related to production for July: A. Materials purchased on account, $225,750. B. Materials requisitioned, $217,600,...
-
Find f'(x) and find the equation of the line tangent to the graph of f at x = 3. f(x)= 5x 2* f'(x)=
-
Table 5.7 shows a small set of predictive model validation results for a classification model, with both actual values and propensities. a. Calculate error rates, sensitivity, and specificity using...
-
A survey was taken on how much trust people place in the information they read on the Internet. The data was shown as follows M S M A M M M M M H M M H M A M A M M M H M H M M M M (ii) Construct a...
-
Given (A, B)= (2,1) (-1,-1) (-1,-1) (-1,2) (a) Use Calculus to solve the bimatrix game (A,B). (b) Determine the rational reaction sets R and R2 for players 1 and 2 respectively and draw them in the...
-
Laural Company paid USD 840,000 cash for real property consisting of a tract of land and a building. The company intended to remodel and use the old building. To allocate the cost of the property...
-
1. Define Quality Function Deployment. 2. Describe the basic structure of the QFD House of Quality. 3. Explain the rationale for QFD. 4. List the principle benefits of QFD. 5. Explain the need for...
-
Supplementary exercises Evaluate the following integrals. 1. St cos 20 5-3 cos 0 de -2x 1 2. de 2+ sin e +2 (sin 0)2 3. S 4. 5. S 2 -2x 5+4 cos 0 1 (2 + sin 0)2 ele 2-e-10 de de de
-
About investment criteria. We have discussed about five investment criteria, including NPV, IRR, PI, AAR and Payback. a) Given that three projects are mutually exclusive and their information is as...
-
The cash flow statement is divided into 3 areas: operations, financing, and investing. What are the major cash flow items in each area? What is the trend of cash flows over a 2-year period? Does the...
-
Find the market equilibrium point for the following demand and supply functions. Demand: 2p = - q + 56 Supply: 3p - q = 34
-
The following information is obtained for a sample of 25 observations taken from a population. SSxx = 274.600, se = .932, and = 280.56 3.77x a. Make a 95% confidence interval for B. b. Using a...
-
The following table gives the total points scored by each of the top 16 National Basketball Association (NBA) scorers during the 201011 regular seasons a. Calculate the mean and median. Do these data...
-
The following data are the ages (in years) of six students. Calculate the standard deviation. Is its value zero? If yes, why? 19 19 19 19 19 19
-
Use the data of Problem 3.8 to find the phase differences of the Loewy function for a double bladed rotor where only the distance between the blades are counted. Make the same computations for...
-
If the gust intensity with time varies as given in Fig. 3.16, obtain the lift and the moment coefficient changes about the midchord and their plots with respect to time. Fig. 3.16 Wg 0 to t
-
Find the lift and the moment coefficients about the midchord of an airfoil which undergoes a sudden vertical translation under zero angle of attack. Use the Wagner function.
Study smarter with the SolutionInn App