

Kevin and Maria are farmers. Each one owns a 20-acre plot of land. The following table shows
Fantastic news! We've Found the answer you've been seeking!
Question:
Kevin and Maria are farmers. Each one owns a 20-acre plot of land. The following table shows the amount of alfalfa and barley each farmer can produce per year on a given acre. Each farmer chooses whether to devote all acres to producing alfalfa or barley or to produce alfalfa on some of the land and barley on the rest. 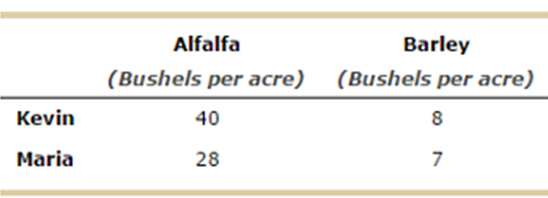
- Has an absolute advantage in the production of alfalfa, and
- Has an absolute advantage in the production of barley. Kevin's opportunity cost of producing 1 bushel of barley is bushels of alfalfa, whereas Maria's opportunity cost of producing 1 bushel of barley
- Opportunity cost of producing barley than Maria,
- Has a comparative is I bushels of alfalfa. Because Kevin has a advantage In the production of barley, and '0' has a comparative advantage in the production of alfalfa.
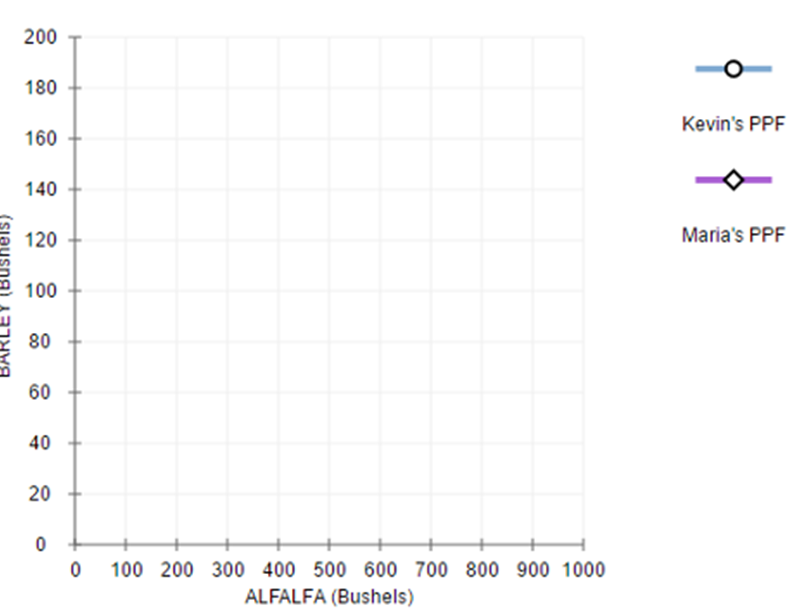
On the following graph, use the blue line (circle symbol) to plot Kevin?s production possibilities frontier (PPF), and use the purple line (diamond symbol) to plot Maria?s PPF.
Expert Answer:
Kevin because Kevin can produce more quantity of alfalfa than Maria has an absolu... View the full answer

Related Book For 

Mathematical Applications for the Management, Life and Social Sciences
ISBN: 9781337625340
12th edition
Authors: Ronald J. Harshbarger, James J. Reynolds
Posted Date:
