

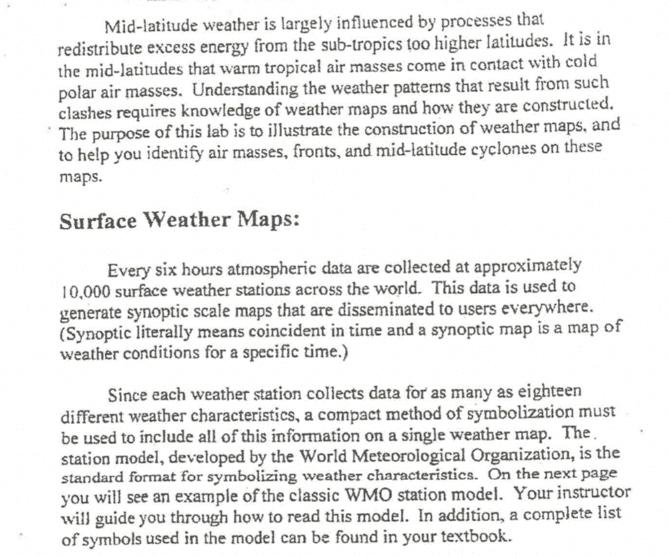
Mid-latitude weather is largely influenced by processes that redistribute excess energy from the sub-tropics too higher...
Fantastic news! We've Found the answer you've been seeking!
Question:

Expert Answer:
The station model is a compact method of representing various weather data on a single weather map T... View the full answer

Related Book For 

Thermodynamics An Engineering Approach
ISBN: 978-0073398174
8th edition
Authors: Yunus A. Cengel, Michael A. Boles
Posted Date:
